INVITE-ONLY SCRIPT
Multi Time Frame MTF Correlation Coefficient meter
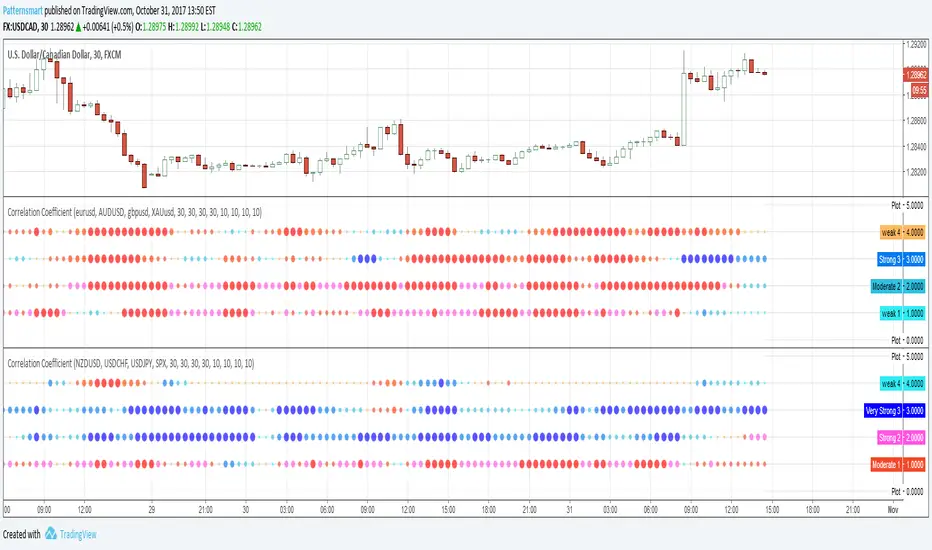
This indicator shows the Correlation Coefficient between the four input symbols and current chart symbol over the corresponding timeframe and period inputs.
You can input four symbols with different aggregation and period settings.
The period input is the number of bars used to calculate the correlation coefficient.
How to Read the Correlation Coefficient indicator
Each dot shows the correlation coefficient between the two symbols over the corresponding timeframe and period inputs. The following categories indicate a quick way of interpreting the table values. Note that a negative correlation means the two currency pairs correlate in the opposite directions (e.g. when the price for one goes up, the other one goes down and vice versa)
Positive 0.0 to 0.25 weak correlation, shown as small cyan dot.
Positive 0.25 to 0.5 Moderate correlation, shown as medium light blue dot.
Positive 0.5 to 0.75 Strong correlation, shown as big light blue dot.
Positive 0.75 to 1.0 Very strong correlation, shown as large blue dot.
Negative 0.0 to 0.25 weak correlation, shown as small orange dot.
Negative 0.25 to 0.5 Moderate correlation, shown as medium orange dot.
Negative 0.5 to 0.75 Strong correlation, shown as big purple dot.
Negative 0.75 to 1.0 Very strong correlation, shown as large red dot.
You can also change the plot style to meet your needs.
초대 전용 스크립트
이 스크립트는 작성자가 승인한 사용자만 접근할 수 있습니다. 사용하려면 요청 후 승인을 받아야 하며, 일반적으로 결제 후에 허가가 부여됩니다. 자세한 내용은 아래 작성자의 안내를 따르거나 Patternsmart에게 직접 문의하세요.
트레이딩뷰는 스크립트의 작동 방식을 충분히 이해하고 작성자를 완전히 신뢰하지 않는 이상, 해당 스크립트에 비용을 지불하거나 사용하는 것을 권장하지 않습니다. 커뮤니티 스크립트에서 무료 오픈소스 대안을 찾아보실 수도 있습니다.
작성자 지시 사항
면책사항
해당 정보와 게시물은 금융, 투자, 트레이딩 또는 기타 유형의 조언이나 권장 사항으로 간주되지 않으며, 트레이딩뷰에서 제공하거나 보증하는 것이 아닙니다. 자세한 내용은 이용 약관을 참조하세요.