PROTECTED SOURCE SCRIPT
업데이트됨 Anchored OBV RSI: "V-RSI"
About the Indicator:
V-RSI uses values from the traditional "Relative Strength Index(RSI)" oscillator and the "On Balance Volume(OBV)" indicator and anchors them into an oscillator format. In doing so, we are given a more concrete overview of volume/sentiment data relative to the RSI for analysis of trend strength and decision making.
EXTRAS: BTC MODE => for BTC only.
In BTC MODE, the indicator uses BTC volume data from the following 5 major exchanges: BINANCE, COINBASE, FTX, BITMEX, BITFINEX.
The sum of this data is taken to depict anchored OBV values. This allows for a more accurate representation of Global Volume.
How to use it
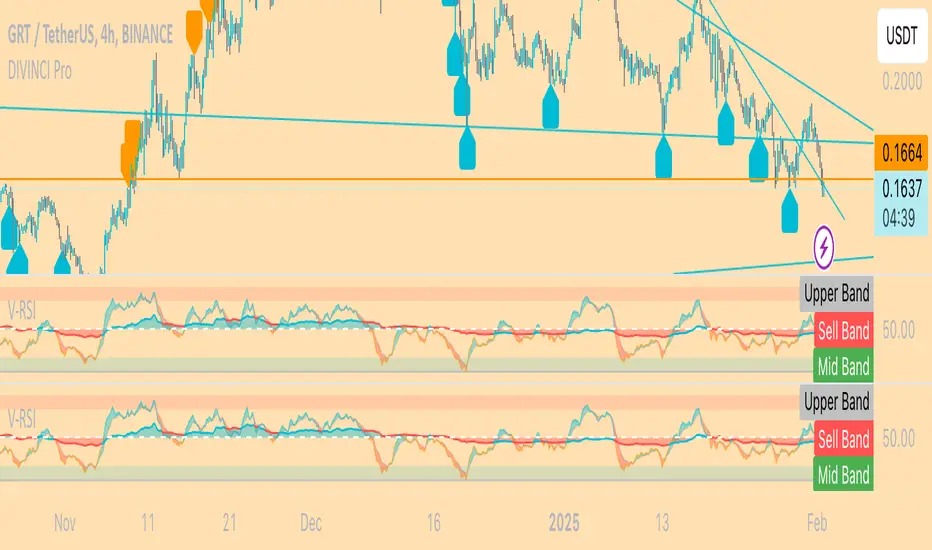
The indicator can be used like the normal RSI with the OBV (area in the middle) showing volume sentiment.
<50 is seen as bearish
>50 is seen as bullish
Using this data, it becomes easier to identify unsustainable trends, reversals, divergences
An example of an unsustainable trend and reversal would be if RSI values are overbought ( RSI > 70) yet OBV oscillator remains below 50.
== chances of unsustainable trend reversal are more likely.
For more questions, send me a message here on Tradingview.
Happy trading,
MM :)
V-RSI uses values from the traditional "Relative Strength Index(RSI)" oscillator and the "On Balance Volume(OBV)" indicator and anchors them into an oscillator format. In doing so, we are given a more concrete overview of volume/sentiment data relative to the RSI for analysis of trend strength and decision making.
EXTRAS: BTC MODE => for BTC only.
In BTC MODE, the indicator uses BTC volume data from the following 5 major exchanges: BINANCE, COINBASE, FTX, BITMEX, BITFINEX.
The sum of this data is taken to depict anchored OBV values. This allows for a more accurate representation of Global Volume.
How to use it
The indicator can be used like the normal RSI with the OBV (area in the middle) showing volume sentiment.
<50 is seen as bearish
>50 is seen as bullish
Using this data, it becomes easier to identify unsustainable trends, reversals, divergences
An example of an unsustainable trend and reversal would be if RSI values are overbought ( RSI > 70) yet OBV oscillator remains below 50.
== chances of unsustainable trend reversal are more likely.
For more questions, send me a message here on Tradingview.
Happy trading,
MM :)
릴리즈 노트
BTC MODE off by default now. Turn it on when trading btc.릴리즈 노트
Added Bybit to ObV data보호된 스크립트입니다
이 스크립트는 비공개 소스로 게시됩니다. 하지만 이를 자유롭게 제한 없이 사용할 수 있습니다 – 자세한 내용은 여기에서 확인하세요.
면책사항
해당 정보와 게시물은 금융, 투자, 트레이딩 또는 기타 유형의 조언이나 권장 사항으로 간주되지 않으며, 트레이딩뷰에서 제공하거나 보증하는 것이 아닙니다. 자세한 내용은 이용 약관을 참조하세요.
보호된 스크립트입니다
이 스크립트는 비공개 소스로 게시됩니다. 하지만 이를 자유롭게 제한 없이 사용할 수 있습니다 – 자세한 내용은 여기에서 확인하세요.
면책사항
해당 정보와 게시물은 금융, 투자, 트레이딩 또는 기타 유형의 조언이나 권장 사항으로 간주되지 않으며, 트레이딩뷰에서 제공하거나 보증하는 것이 아닙니다. 자세한 내용은 이용 약관을 참조하세요.