PROTECTED SOURCE SCRIPT
업데이트됨 GMS: The Oscillator
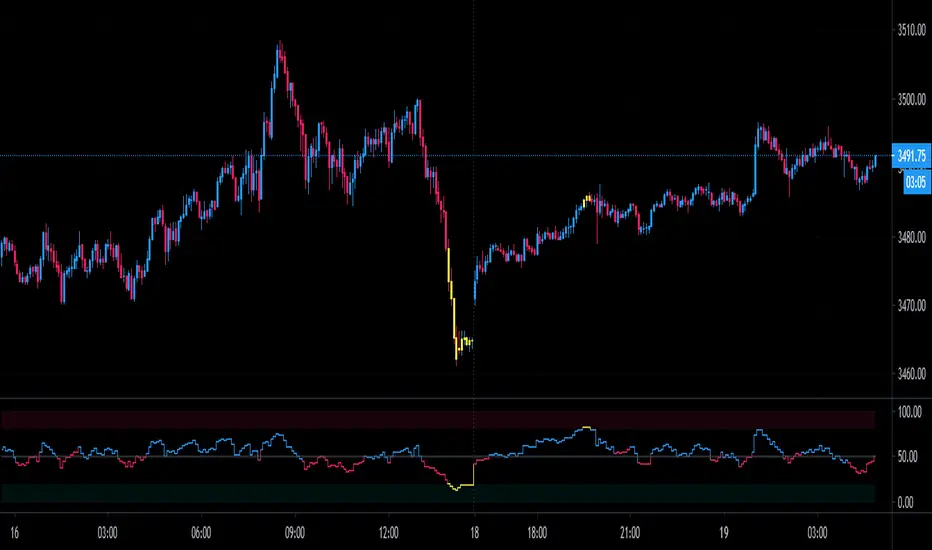
This is my version of an RSI. Basically treat it the same way, but needless to say there's a few more things going into it than just the closing price.
The color of the line is based on my HAMA JAMMA indicator so they could be used in conjunction to help pick potential trend reversals in either direction, overbought and oversold levels will turn the line yellow.
The "Make that a combo?" selection will change the curve and make it more sensitive to sharper price movements.
This works on any time frame as well as any bar type, although for certain bar types you'll probably have to tweak the settings to see what works.
I hope it helps,
Andre
릴리즈 노트
To make it visually easier, at a user's request I added in barcolor for when the indicator is overbought or oversold so the bar itself will turn yellow.보호된 스크립트입니다
이 스크립트는 비공개 소스로 게시됩니다. 하지만 이를 자유롭게 제한 없이 사용할 수 있습니다 – 자세한 내용은 여기에서 확인하세요.
면책사항
해당 정보와 게시물은 금융, 투자, 트레이딩 또는 기타 유형의 조언이나 권장 사항으로 간주되지 않으며, 트레이딩뷰에서 제공하거나 보증하는 것이 아닙니다. 자세한 내용은 이용 약관을 참조하세요.
보호된 스크립트입니다
이 스크립트는 비공개 소스로 게시됩니다. 하지만 이를 자유롭게 제한 없이 사용할 수 있습니다 – 자세한 내용은 여기에서 확인하세요.
면책사항
해당 정보와 게시물은 금융, 투자, 트레이딩 또는 기타 유형의 조언이나 권장 사항으로 간주되지 않으며, 트레이딩뷰에서 제공하거나 보증하는 것이 아닙니다. 자세한 내용은 이용 약관을 참조하세요.