PROTECTED SOURCE SCRIPT
Burt's Multi-EMA Ribbon
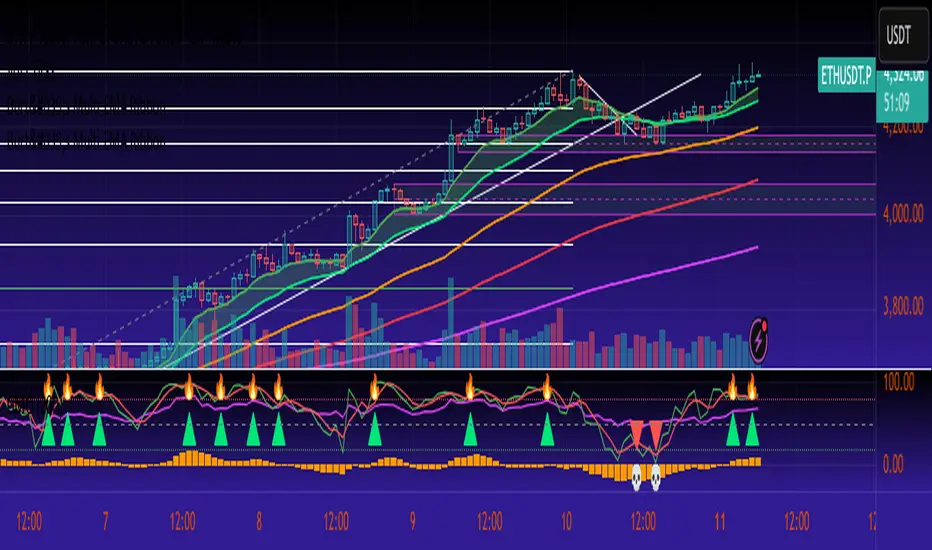
Burt’s Multi-EMA Ribbon is a simple tool for visualising multiple Exponential Moving Averages (EMAs) on the same chart.
It plots the 9, 21, 50, 100, and 200-period EMAs, allowing users to observe their relative positioning. The space between the EMA 9 and EMA 21 is shaded to highlight their relationship.
The script also includes optional alert conditions that notify when EMA 9 moves above or below EMA 21. These features can help traders monitor changes in EMA alignment without constantly watching the chart.
This indicator is intended as an analytical aid and should be used together with other forms of chart analysis. It does not provide buy or sell recommendations.
보호된 스크립트입니다
이 스크립트는 비공개 소스로 게시됩니다. 하지만 이를 자유롭게 제한 없이 사용할 수 있습니다 – 자세한 내용은 여기에서 확인하세요.
면책사항
해당 정보와 게시물은 금융, 투자, 트레이딩 또는 기타 유형의 조언이나 권장 사항으로 간주되지 않으며, 트레이딩뷰에서 제공하거나 보증하는 것이 아닙니다. 자세한 내용은 이용 약관을 참조하세요.
면책사항
해당 정보와 게시물은 금융, 투자, 트레이딩 또는 기타 유형의 조언이나 권장 사항으로 간주되지 않으며, 트레이딩뷰에서 제공하거나 보증하는 것이 아닙니다. 자세한 내용은 이용 약관을 참조하세요.