OPEN-SOURCE SCRIPT
Difference from Highest Price (Last N Candles)
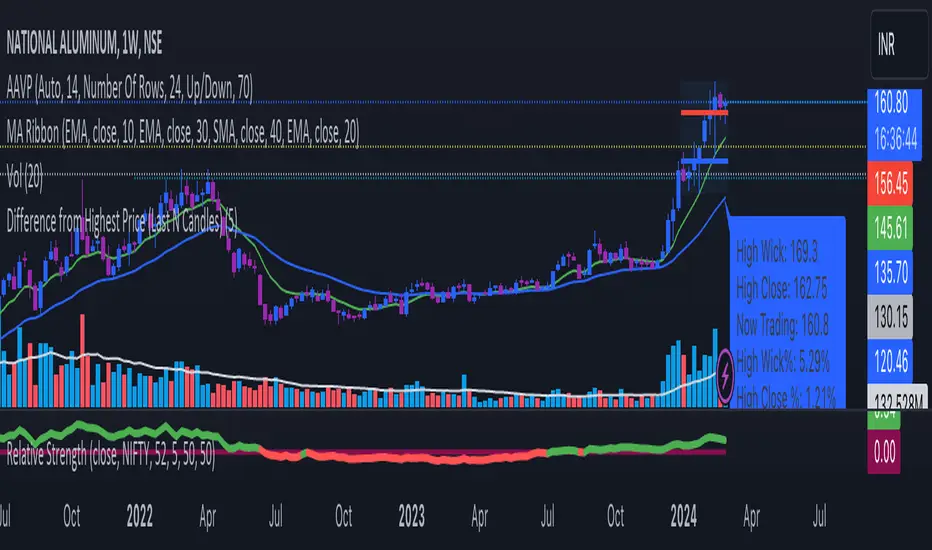
The output of this TradingView indicator is a label that appears below the latest candle on the chart. This label provides information about:
The highest high of the last N candles.
The highest close of the last N candles.
The current trading price.
The percentage difference between the highest high and the current trading price.
The percentage difference between the highest close and the current trading price.
The percentage change in price from the previous candle.
The N-day average percentage change.
This information is useful for traders to understand the relationship between the current price and recent price action, as well as to identify potential overbought or oversold conditions based on the comparison with recent highs and closes.
Here's a breakdown of what the code does:
It takes an input parameter for the number of days (or candles) to consider (input_days).
It calculates the highest high and highest close of the last N candles (highest_last_n_high and highest_last_n_close).
It calculates the difference between the close of the current candle and the close of the previous candle (diff), along with the percentage change.
It maintains an array of percentage changes of the last N days (percentage_changes), updating it with the latest percentage change.
It calculates the sum of percentage changes and the N-day average percentage change.
It calculates the difference between the highest high/highest close of the last N candles and the current trading price, along with their percentage differences.
Finally, it plots this information as a label below the candle for the latest bar.
오픈 소스 스크립트
트레이딩뷰의 진정한 정신에 따라, 이 스크립트의 작성자는 이를 오픈소스로 공개하여 트레이더들이 기능을 검토하고 검증할 수 있도록 했습니다. 작성자에게 찬사를 보냅니다! 이 코드는 무료로 사용할 수 있지만, 코드를 재게시하는 경우 하우스 룰이 적용된다는 점을 기억하세요.
면책사항
해당 정보와 게시물은 금융, 투자, 트레이딩 또는 기타 유형의 조언이나 권장 사항으로 간주되지 않으며, 트레이딩뷰에서 제공하거나 보증하는 것이 아닙니다. 자세한 내용은 이용 약관을 참조하세요.
오픈 소스 스크립트
트레이딩뷰의 진정한 정신에 따라, 이 스크립트의 작성자는 이를 오픈소스로 공개하여 트레이더들이 기능을 검토하고 검증할 수 있도록 했습니다. 작성자에게 찬사를 보냅니다! 이 코드는 무료로 사용할 수 있지만, 코드를 재게시하는 경우 하우스 룰이 적용된다는 점을 기억하세요.
면책사항
해당 정보와 게시물은 금융, 투자, 트레이딩 또는 기타 유형의 조언이나 권장 사항으로 간주되지 않으며, 트레이딩뷰에서 제공하거나 보증하는 것이 아닙니다. 자세한 내용은 이용 약관을 참조하세요.