OPEN-SOURCE SCRIPT
Two EMA's crossing w/ TRIX & ADX/DI & EMA@RSI filtering
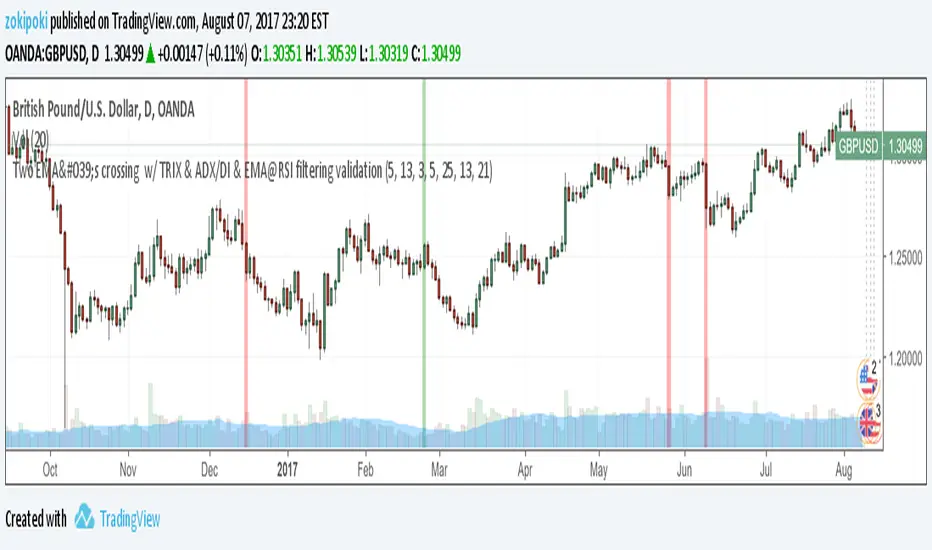
The initial idea for the "X-candle" script is from nmike, and the requirement was to mark the bar with positive or negative as EMA(5) and EMA(13) cross. Later, it was requested to filter the above with Trix(3) so it just crosses the "zero" line and goes in either positive or negative territory - confirming the EMA's crossing.
In addition, one of my ideas was to integrate 2 more rules, and the final looked something like this ...
The script marks the candle vertical background with green or red when all 4 rules are satisfied:
1. Between the current and previous bar has to be a cross of the EMA lines (by default: EMA 5 and EMA 13)
2. The current bar is the first or second bar crossing the zero TRIX line ... going in either Positive or Negative range, confirming the first rule
3. ADX is above threshold 25 & DI is also valid (higher than the opposite DI) ... confirming trend direction and strength
4. EMA(21) on top of RSI(13), one of my favorites, so it has to be valid also
At the end the script did extensive filtering, and it does filter some good ones also. Needs more work, less filtering, more tolerance, and new rules. All of the above indicator parameters can be modified easily, so anybody can play with. If you find some better indicator parameters that will provide a more efficient filtering, please let us know and drop me a note.
Thanks!
오픈 소스 스크립트
트레이딩뷰의 진정한 정신에 따라, 이 스크립트의 작성자는 이를 오픈소스로 공개하여 트레이더들이 기능을 검토하고 검증할 수 있도록 했습니다. 작성자에게 찬사를 보냅니다! 이 코드는 무료로 사용할 수 있지만, 코드를 재게시하는 경우 하우스 룰이 적용된다는 점을 기억하세요.
면책사항
해당 정보와 게시물은 금융, 투자, 트레이딩 또는 기타 유형의 조언이나 권장 사항으로 간주되지 않으며, 트레이딩뷰에서 제공하거나 보증하는 것이 아닙니다. 자세한 내용은 이용 약관을 참조하세요.
오픈 소스 스크립트
트레이딩뷰의 진정한 정신에 따라, 이 스크립트의 작성자는 이를 오픈소스로 공개하여 트레이더들이 기능을 검토하고 검증할 수 있도록 했습니다. 작성자에게 찬사를 보냅니다! 이 코드는 무료로 사용할 수 있지만, 코드를 재게시하는 경우 하우스 룰이 적용된다는 점을 기억하세요.
면책사항
해당 정보와 게시물은 금융, 투자, 트레이딩 또는 기타 유형의 조언이나 권장 사항으로 간주되지 않으며, 트레이딩뷰에서 제공하거나 보증하는 것이 아닙니다. 자세한 내용은 이용 약관을 참조하세요.