OPEN-SOURCE SCRIPT
PCE Inflation Monitor (Change YoY & MoM)
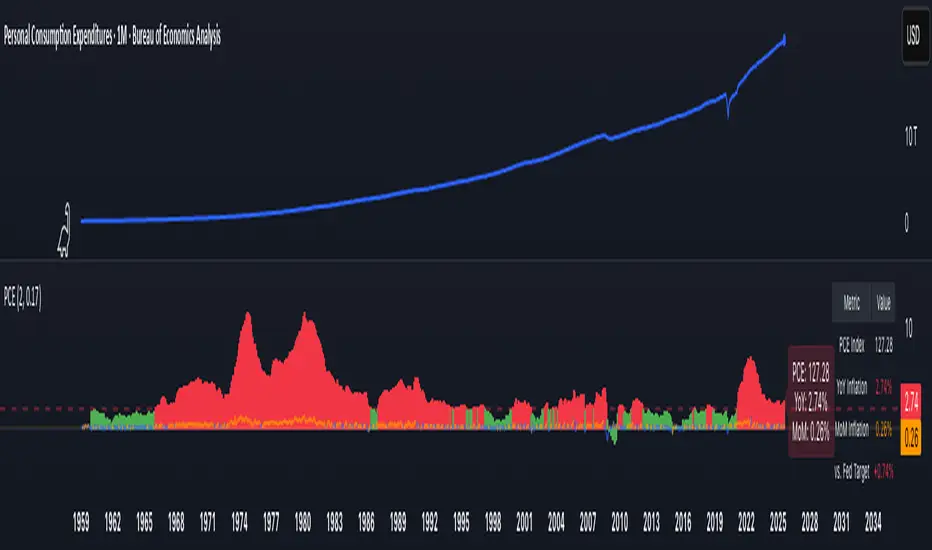
📊 PCE Inflation Monitor - The Fed's Most Important Metric
Personal Consumption Expenditures (PCE) is the Federal Reserve's preferred inflation measure and THE metric they target for their 2% inflation goal. If you want to predict Fed policy, you need to watch PCE.
🎯 KEY FEATURES:
- Dual Perspective Analysis:
- Year-over-Year (YoY): Histogram bars showing annual PCE inflation
- Month-over-Month (MoM): Line overlay showing monthly consumption price changes
- Visual Reference System:
- Dashed line at 2% (Fed's official PCE inflation target)
- Dotted line at 0.17% (equivalent monthly target)
- Color-coded bars: Red above Fed target, Green below target
- Real-Time Data Table:
- Current PCE Index value
- YoY inflation rate vs. Fed's 2% target
- MoM inflation rate with color coding
- Exact deviation from Fed target (critical for policy predictions)
- Automated Alerts:
- PCE crosses Fed's 2% target (major policy signal!)
- MoM crosses monthly target
- Stay informed of Fed-relevant inflation changes
📈 WHY PCE IS DIFFERENT (AND MORE IMPORTANT):
PCE vs. CPI differences:
- Flexible basket: PCE adjusts for substitution (beef → chicken if prices rise)
- Broader coverage: Includes healthcare paid by insurance/government
- Lower readings: Typically 0.2-0.4% below CPI
- Fed's choice: Explicitly stated as their target metric
Most importantly: When Powell speaks about "our 2% target," he means PCE, not CPI!
🔍 TRADING IMPLICATIONS:
PCE Above 2% (Red Zone):
→ Fed under pressure to maintain/raise rates
→ Hawkish policy stance likely
→ Negative for growth stocks, crypto
→ Positive for USD, bearish for gold
PCE Below 2% (Green Zone):
→ Fed has flexibility to cut rates
→ Dovish policy stance possible
→ Positive for risk assets, growth stocks
→ Negative for USD, bullish for commodities
PCE Approaching 2% from Above:
→ Fed "mission accomplished" narrative
→ Rate cut cycle becomes possible
→ Major bullish signal for equities/crypto
💡 ADVANCED STRATEGIES:
1. Fed Meeting Preparation: Check PCE before FOMC meetings for policy clues
2. Dot Plot Predictions: PCE trend determines Fed's rate forecast updates
3. Pivot Timing: When PCE MoM turns negative, Fed pivot becomes realistic
4. Press Conference Analysis: Compare Powell's comments to PCE deviation
🎯 KEY LEVELS TO WATCH:
- 2.0% YoY: Fed's official target - crossing this level is major news
- 2.5% YoY: "Uncomfortably high" - Fed forced to stay restrictive
- 3.0% YoY: "Crisis mode" - Fed turns very hawkish
- 1.5% YoY: "Below target" - Rate cuts become likely
🔄 COMBINE WITH:
- CPI: Public perception vs. Fed's metric (often diverge)
- Core PCE: Even more important (excludes food/energy volatility)
- Fed Funds Rate: Is Fed responding appropriately to PCE?
📊 DATA SOURCE:
Official PCE data from FRED (Federal Reserve Economic Data), updated monthly typically in the last week of each month (after CPI/PPI releases).
🎨 CUSTOMIZATION:
Fully customizable:
- Toggle YoY/MoM displays
- Adjust Fed target if needed
- Customize colors
- Show/hide absolute PCE values
Perfect for: Fed watchers, macro traders, policy analysts, and serious investors who want to predict monetary policy changes before they happen.
⚠️ CRITICAL INSIGHT: While media focuses on CPI, the Fed focuses on PCE. Trade what the Fed trades, not what the headlines say.
🎓 Pro Tip: Fed members often mention "Core PCE" (excluding food/energy). Consider adding that indicator alongside this one for complete Fed policy analysis.
오픈 소스 스크립트
트레이딩뷰의 진정한 정신에 따라, 이 스크립트의 작성자는 이를 오픈소스로 공개하여 트레이더들이 기능을 검토하고 검증할 수 있도록 했습니다. 작성자에게 찬사를 보냅니다! 이 코드는 무료로 사용할 수 있지만, 코드를 재게시하는 경우 하우스 룰이 적용된다는 점을 기억하세요.
면책사항
해당 정보와 게시물은 금융, 투자, 트레이딩 또는 기타 유형의 조언이나 권장 사항으로 간주되지 않으며, 트레이딩뷰에서 제공하거나 보증하는 것이 아닙니다. 자세한 내용은 이용 약관을 참조하세요.
오픈 소스 스크립트
트레이딩뷰의 진정한 정신에 따라, 이 스크립트의 작성자는 이를 오픈소스로 공개하여 트레이더들이 기능을 검토하고 검증할 수 있도록 했습니다. 작성자에게 찬사를 보냅니다! 이 코드는 무료로 사용할 수 있지만, 코드를 재게시하는 경우 하우스 룰이 적용된다는 점을 기억하세요.
면책사항
해당 정보와 게시물은 금융, 투자, 트레이딩 또는 기타 유형의 조언이나 권장 사항으로 간주되지 않으며, 트레이딩뷰에서 제공하거나 보증하는 것이 아닙니다. 자세한 내용은 이용 약관을 참조하세요.