OPEN-SOURCE SCRIPT
Sector Relative Strength
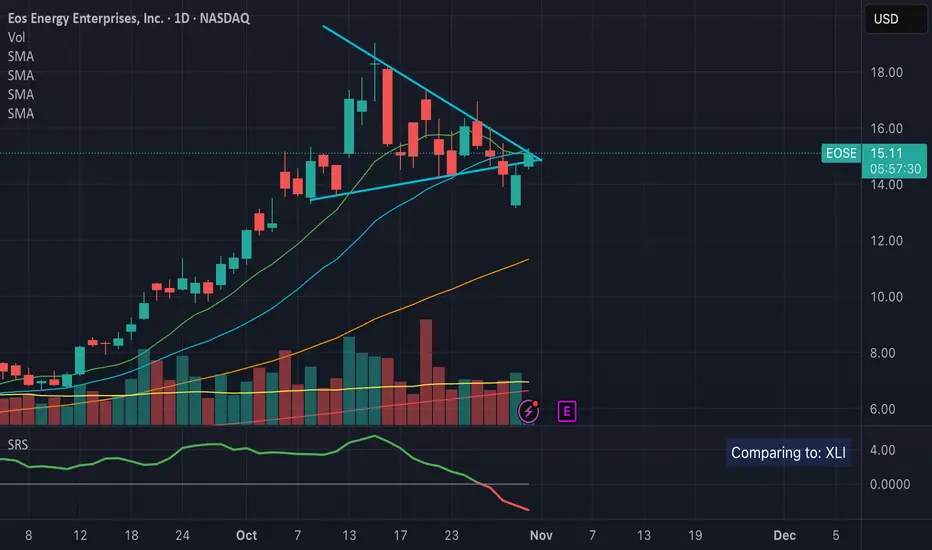
This indicator measures a stock's Real Relative Strength against its sector benchmark, helping you identify stocks that are outperforming or underperforming their sector peers.
The concept is based on the Real Relative Strength methodology popularized by the r/realdaytrading community.
Unlike traditional relative strength calculations that simply compare price ratios, this indicator uses a more sophisticated approach that accounts for volatility through ATR (Average True Range), providing a normalized view of true relative performance.
Key Features
Automatic Sector Detection
Automatically detects your stock's sector using TradingView's built-in sector classification
Maps to the appropriate SPDR Sector ETF (XLK, XLF, XLV, XLY, XLP, XLI, XLE, XLU, XLB, XLC)
Supports all 20 TradingView sectors
Sector ETF Mappings
The indicator automatically compares your stock against:
Technology: XLK (Technology Services, Electronic Technology)
Financials: XLF (Finance sector)
Healthcare: XLV (Health Technology, Health Services)
Consumer Discretionary: XLY (Retail Trade, Consumer Services, Consumer Durables)
Consumer Staples: XLP (Consumer Non-Durables)
Industrials: XLI (Producer Manufacturing, Industrial Services, Transportation, Commercial Services)
Energy: XLE (Energy Minerals)
Utilities: XLU
Materials: XLB (Non-Energy Minerals, Process Industries)
Communications: XLC
Default: SPY (for Miscellaneous or unclassified sectors)
Customizable Settings
Comparison Mode: Choose between automatic sector comparison or custom symbol
Length: Adjustable lookback period (default: 12)
Smoothing: Apply moving average to reduce noise (default: 3)
Visual Clarity
Green line: Stock is outperforming its sector
Red line: Stock is underperforming its sector
Zero baseline: Clear reference point for performance
Clean info box: Shows which ETF you're comparing against
How It Works
The indicator calculates relative strength using the following methodology:
Rolling Price Change: Measures the price movement over the specified length for both the stock and its sector ETF
ATR Normalization: Uses Average True Range to normalize for volatility differences
Power Index: Calculates the sector's strength relative to its volatility
Real Relative Strength: Compares the stock's performance against the sector's power index
Smoothing: Applies a moving average to reduce single-candle spikes
Formula:
Power Index = (Sector Price Change) / (Sector ATR)
RRS = (Stock Price Change - Power Index × Stock ATR) / Stock ATR
Smoothed RRS = SMA(RRS, Smoothing Length)
오픈 소스 스크립트
트레이딩뷰의 진정한 정신에 따라, 이 스크립트의 작성자는 이를 오픈소스로 공개하여 트레이더들이 기능을 검토하고 검증할 수 있도록 했습니다. 작성자에게 찬사를 보냅니다! 이 코드는 무료로 사용할 수 있지만, 코드를 재게시하는 경우 하우스 룰이 적용된다는 점을 기억하세요.
면책사항
해당 정보와 게시물은 금융, 투자, 트레이딩 또는 기타 유형의 조언이나 권장 사항으로 간주되지 않으며, 트레이딩뷰에서 제공하거나 보증하는 것이 아닙니다. 자세한 내용은 이용 약관을 참조하세요.
오픈 소스 스크립트
트레이딩뷰의 진정한 정신에 따라, 이 스크립트의 작성자는 이를 오픈소스로 공개하여 트레이더들이 기능을 검토하고 검증할 수 있도록 했습니다. 작성자에게 찬사를 보냅니다! 이 코드는 무료로 사용할 수 있지만, 코드를 재게시하는 경우 하우스 룰이 적용된다는 점을 기억하세요.
면책사항
해당 정보와 게시물은 금융, 투자, 트레이딩 또는 기타 유형의 조언이나 권장 사항으로 간주되지 않으며, 트레이딩뷰에서 제공하거나 보증하는 것이 아닙니다. 자세한 내용은 이용 약관을 참조하세요.