OPEN-SOURCE SCRIPT
Momentum Profile
Profile market behavior in horizontal zones
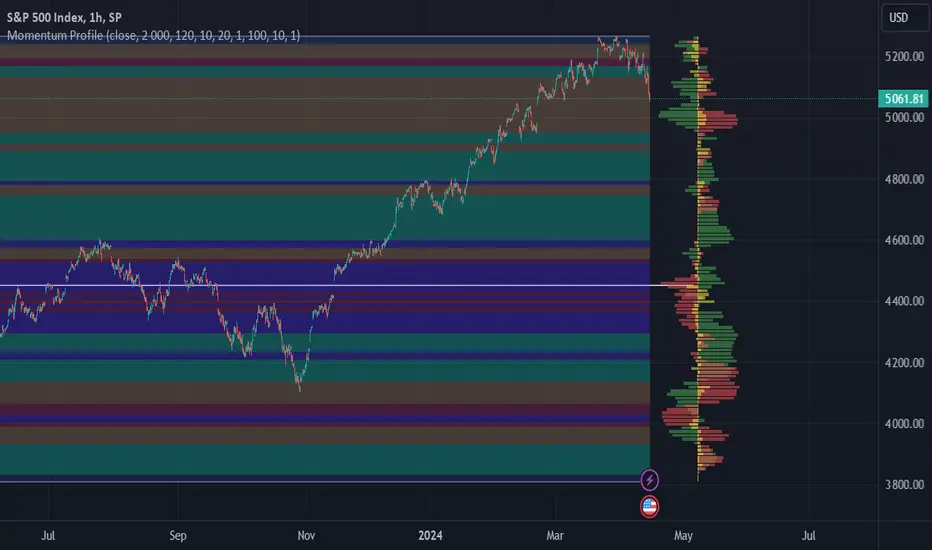
Profile Sidebar
Buckets pointing rightward indicate upward security movement in the lookahead window at that level, and buckets pointing leftward indicate downward movement in the lookahead window.
Green profile buckets indicate the security's behavior following an uptrend in the lookbehind window. Conversely, Red profile buckets show security's behavior following a downtrend in the lookbehind window. Yellow profile buckets show behavior following sideways movement.
Buckets length corelates with the amount of movement measured in that direction at that level.
Inputs
Length determines how many bars back are considered for the calculation. On most securities, this can be increased to just above 4000 without issues.
Rows determines the number of buckets that the securities range is divided into.
You can increase or decrease the threshold for which moves are considered sideways with the sideways_filter input: higher means more moves are considered sideways.
The lookbehind input determines the lookbehind window. Specifically, how many bars back are considered when determining whether a data point is considered green (uptrend), red (downtrend), or yellow (no significant trend).
The lookahead input determines how many bars after the current bar are considered when determining the length and direction of each bucket (leftward for downward moves, rightward for upward moves).
Profile_width and Profile_spacing are cosmetic choices.
Intrabar support is not current supported.
Region Highlighting
Regions highlighted green saw an upward move in the lookahead window for both lookbehind downtrends and uptrends. In other words, both red and green profile buckets pointed rightward.
Regions highlighted red saw a downward move in the lookahead window both for lookbehind downtrends and uptrends.
Regions highlighted brown indicate a reversal region: uptrends were followed by downtrends, and vice versa. These regions often indicate a chop range or sometimes support/resistance levels. On the profile, this means that green buckets pointed left, and red buckets pointed right.
Regions highlighted purple indicate that whatever direction the security was moving, it continued that way. On the profile, this means that green buckets pointed right, and red buckets pointed left in that region.
오픈 소스 스크립트
트레이딩뷰의 진정한 정신에 따라, 이 스크립트의 작성자는 이를 오픈소스로 공개하여 트레이더들이 기능을 검토하고 검증할 수 있도록 했습니다. 작성자에게 찬사를 보냅니다! 이 코드는 무료로 사용할 수 있지만, 코드를 재게시하는 경우 하우스 룰이 적용된다는 점을 기억하세요.
면책사항
해당 정보와 게시물은 금융, 투자, 트레이딩 또는 기타 유형의 조언이나 권장 사항으로 간주되지 않으며, 트레이딩뷰에서 제공하거나 보증하는 것이 아닙니다. 자세한 내용은 이용 약관을 참조하세요.
오픈 소스 스크립트
트레이딩뷰의 진정한 정신에 따라, 이 스크립트의 작성자는 이를 오픈소스로 공개하여 트레이더들이 기능을 검토하고 검증할 수 있도록 했습니다. 작성자에게 찬사를 보냅니다! 이 코드는 무료로 사용할 수 있지만, 코드를 재게시하는 경우 하우스 룰이 적용된다는 점을 기억하세요.
면책사항
해당 정보와 게시물은 금융, 투자, 트레이딩 또는 기타 유형의 조언이나 권장 사항으로 간주되지 않으며, 트레이딩뷰에서 제공하거나 보증하는 것이 아닙니다. 자세한 내용은 이용 약관을 참조하세요.