OPEN-SOURCE SCRIPT
Overextended vs 50DMA Detector
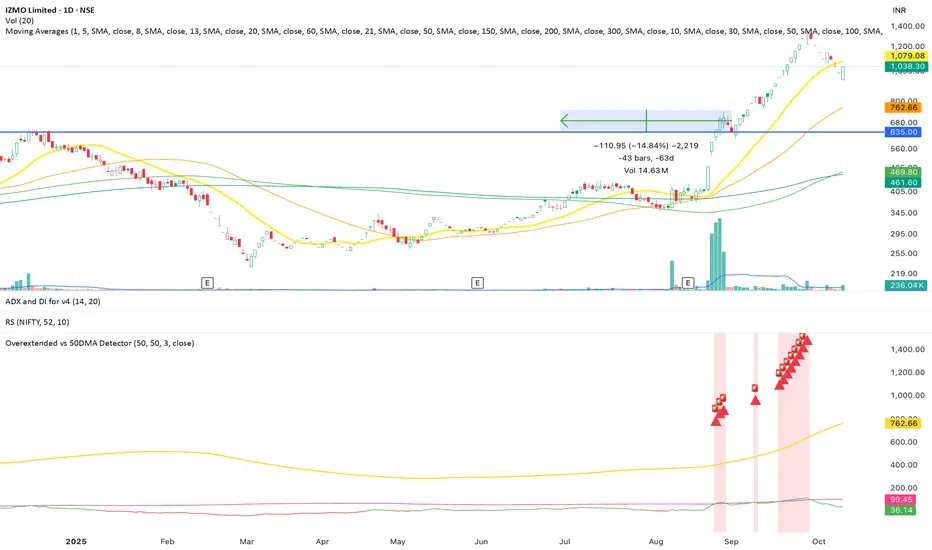
This indicator helps traders identify when a stock or asset becomes statistically overextended relative to its 50-day moving average (50DMA) — a key signal for potential pullbacks, consolidations, or profit-taking zones.
⸻
🔍 What It Does
• Calculates the 50-day simple moving average (SMA) of price.
• Computes the percentage gap between current price and the 50DMA.
• Measures the standard deviation of that percentage gap to assess volatility-adjusted extremes.
• Flags the stock as “Overextended” when:
• Price is more than 20% above the 50DMA, and
• The % gap is greater than 3× its historical standard deviation.
When these conditions are met, the script:
• Highlights the candle with a 🚨 red triangle on the chart.
• Shades the background to indicate potential overheating.
• Triggers an alert condition so traders can be notified in real time.
오픈 소스 스크립트
트레이딩뷰의 진정한 정신에 따라, 이 스크립트의 작성자는 이를 오픈소스로 공개하여 트레이더들이 기능을 검토하고 검증할 수 있도록 했습니다. 작성자에게 찬사를 보냅니다! 이 코드는 무료로 사용할 수 있지만, 코드를 재게시하는 경우 하우스 룰이 적용된다는 점을 기억하세요.
면책사항
해당 정보와 게시물은 금융, 투자, 트레이딩 또는 기타 유형의 조언이나 권장 사항으로 간주되지 않으며, 트레이딩뷰에서 제공하거나 보증하는 것이 아닙니다. 자세한 내용은 이용 약관을 참조하세요.
오픈 소스 스크립트
트레이딩뷰의 진정한 정신에 따라, 이 스크립트의 작성자는 이를 오픈소스로 공개하여 트레이더들이 기능을 검토하고 검증할 수 있도록 했습니다. 작성자에게 찬사를 보냅니다! 이 코드는 무료로 사용할 수 있지만, 코드를 재게시하는 경우 하우스 룰이 적용된다는 점을 기억하세요.
면책사항
해당 정보와 게시물은 금융, 투자, 트레이딩 또는 기타 유형의 조언이나 권장 사항으로 간주되지 않으며, 트레이딩뷰에서 제공하거나 보증하는 것이 아닙니다. 자세한 내용은 이용 약관을 참조하세요.