OPEN-SOURCE SCRIPT
[TradersPost] Simple Trend Lines
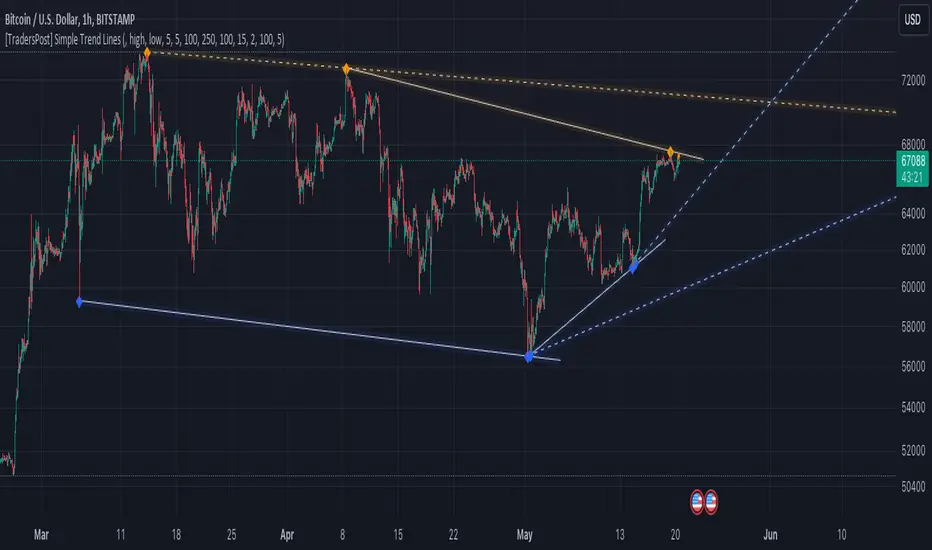
This script is designed to identify and visualize trends based on pivot highs and pivot lows over a user-defined timeframe on trading charts. It enhances trading strategy by dynamically plotting trend lines and adjusting to price changes, providing traders with real-time insights into potential breakout or breakdown points. This utility is crucial for those looking to refine entry and exit strategies based on technical trend analysis.
FEATURES
Dynamic Trend Lines: Automatically draws and updates trend lines based on pivot highs and pivot lows, helping traders to visualize current trends and potential reversal points.
Customizable Parameters: Offers extensive input options for users to define the number of bars to the left and right of pivots, the number of trends to track, and the sensitivity of the trend detection.
Trend Confirmation and Deletion: Includes features to confirm trends through multiple touchpoints and optionally remove broken trends from the display, keeping the chart uncluttered and focused on relevant information.
Design Flexibility: Users can customize the color and style of trend lines and labels, adapting the visual aspects of the script to their preferences or chart themes.
Performance Optimization: Utilizes efficient data structures and algorithms to manage memory and processing demands, ensuring that the script remains responsive even with extensive data.
DISCLAIMER
This script is provided for informational purposes only and does not guarantee profitability. It is still in the experimental phase and should be used as part of a comprehensive trading strategy that includes risk management and due diligence. Users should trade based on their own analysis and risk tolerance.
오픈 소스 스크립트
트레이딩뷰의 진정한 정신에 따라, 이 스크립트의 작성자는 이를 오픈소스로 공개하여 트레이더들이 기능을 검토하고 검증할 수 있도록 했습니다. 작성자에게 찬사를 보냅니다! 이 코드는 무료로 사용할 수 있지만, 코드를 재게시하는 경우 하우스 룰이 적용된다는 점을 기억하세요.
면책사항
해당 정보와 게시물은 금융, 투자, 트레이딩 또는 기타 유형의 조언이나 권장 사항으로 간주되지 않으며, 트레이딩뷰에서 제공하거나 보증하는 것이 아닙니다. 자세한 내용은 이용 약관을 참조하세요.
오픈 소스 스크립트
트레이딩뷰의 진정한 정신에 따라, 이 스크립트의 작성자는 이를 오픈소스로 공개하여 트레이더들이 기능을 검토하고 검증할 수 있도록 했습니다. 작성자에게 찬사를 보냅니다! 이 코드는 무료로 사용할 수 있지만, 코드를 재게시하는 경우 하우스 룰이 적용된다는 점을 기억하세요.
면책사항
해당 정보와 게시물은 금융, 투자, 트레이딩 또는 기타 유형의 조언이나 권장 사항으로 간주되지 않으며, 트레이딩뷰에서 제공하거나 보증하는 것이 아닙니다. 자세한 내용은 이용 약관을 참조하세요.