OPEN-SOURCE SCRIPT
업데이트됨 TASC 2024.06 REIT ETF Trading System
█ OVERVIEW
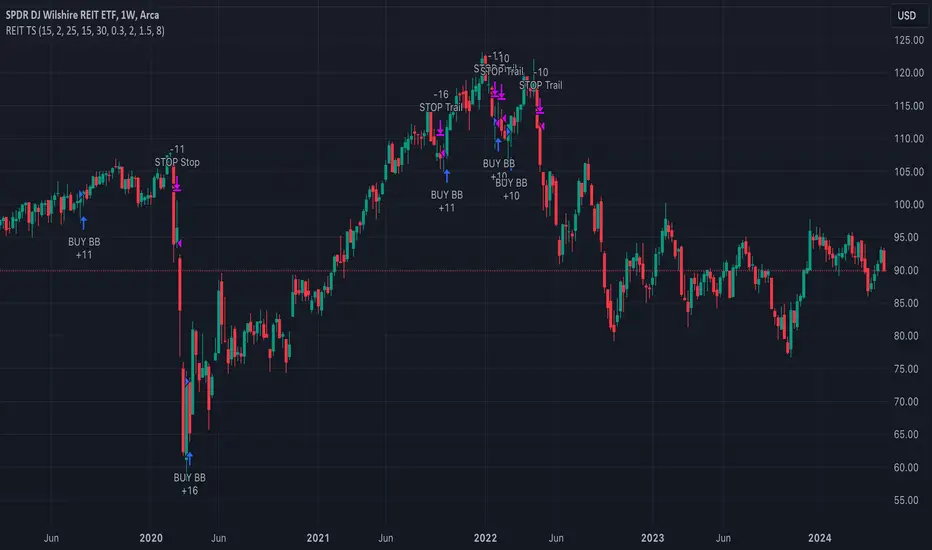
This strategy script demonstrates the application of the Real Estate Investment Trust (REIT) ETF trading system presented in the article by Markos Katsanos titled "Is The Price REIT?" from TASC's June 2024 edition of Traders' Tips.
█ CONCEPTS
REIT stocks and ETFs offer a simplified, diversified approach to real estate investment. They exhibit sensitivity to interest rates, often moving inversely to interest rate and treasury yield changes. Markos Katsanos explores this relationship and the correlation of prices with the broader market to develop a trading strategy for REIT ETFs.
The script employs Bollinger Bands and Donchian channel indicators to identify oversold conditions and trends in REIT ETFs. It incorporates the 10-year treasury yield index (TNX) as a proxy for interest rates and the S&P 500 ETF (SPY) as a benchmark for the overall market. The system filters trade entries based on their behavior and correlation with the REIT ETF price.
█ CALCULATIONS
The strategy initiates long entries (buy signals) under two conditions:
1. Oversold condition
2. Uptrend
The strategy also includes three exit (sell) rules:
1. Trailing (Chandelier) stop
2. Stop-loss
3. Overbought condition
█ DISCLAIMER
This strategy script educates users on the system outlined by the TASC article. However, note that its default properties might not fully represent real-world trading conditions for an individual. By default, it uses 10% of equity as the order size and a slippage amount of 5 ticks. Traders should adjust these settings and the commission amount when using this script. Additionally, since this strategy utilizes compound conditions on weekly data to trigger orders, it will generate significantly fewer trades than other, higher-frequency strategies.
This strategy script demonstrates the application of the Real Estate Investment Trust (REIT) ETF trading system presented in the article by Markos Katsanos titled "Is The Price REIT?" from TASC's June 2024 edition of Traders' Tips.
█ CONCEPTS
REIT stocks and ETFs offer a simplified, diversified approach to real estate investment. They exhibit sensitivity to interest rates, often moving inversely to interest rate and treasury yield changes. Markos Katsanos explores this relationship and the correlation of prices with the broader market to develop a trading strategy for REIT ETFs.
The script employs Bollinger Bands and Donchian channel indicators to identify oversold conditions and trends in REIT ETFs. It incorporates the 10-year treasury yield index (TNX) as a proxy for interest rates and the S&P 500 ETF (SPY) as a benchmark for the overall market. The system filters trade entries based on their behavior and correlation with the REIT ETF price.
█ CALCULATIONS
The strategy initiates long entries (buy signals) under two conditions:
1. Oversold condition
- The weekly ETF low price dips below the 15-week Bollinger Band bottom, the closing price is above the value by at least 0.2 * ATR (Average True Range), and the price exceeds the week's median.
- Either of the following:
– The TNX index is down over 15% from its 25-week high, and its correlation with the ETF price is less than 0.3.
– The yield is below 2%.
2. Uptrend
- The weekly ETF price crosses above the previous week's 30-week Donchian channel high.
- The SPY ETF is above its 20-week moving average.
- Either of the following:
– Over ten weeks have passed since the TNX index was at its 30-week high.
– The correlation between the TNX value and the ETF price exceeds 0.3.
– The yield is below 2%.
The strategy also includes three exit (sell) rules:
1. Trailing (Chandelier) stop
- The weekly close drops below the highest close over the last five weeks by over 1.5 * ATR.
- The TNX value rises over the latest 25 weeks, with a yield exceeding 4%, or its value surges over 15% above the 25-week low.
2. Stop-loss
- The ETF's price declines by at least 8% of the previous week's close and falls below the 30-week moving average.
- The SPY price is down by at least 8%, or its correlation with the ETF's price is negative.
3. Overbought condition
- The ETF's value rises above the 100-week low by over 50%.
- The ETF's price falls over 1.5 * ATR below the 3-week high.
- The ETF's 10-week Stochastic indicator exceeds 90 within the last three weeks.
█ DISCLAIMER
This strategy script educates users on the system outlined by the TASC article. However, note that its default properties might not fully represent real-world trading conditions for an individual. By default, it uses 10% of equity as the order size and a slippage amount of 5 ticks. Traders should adjust these settings and the commission amount when using this script. Additionally, since this strategy utilizes compound conditions on weekly data to trigger orders, it will generate significantly fewer trades than other, higher-frequency strategies.
릴리즈 노트
Important Update: The yield calculation in the script has been corrected by removing the division of TNX by 10, addressing the discrepancy with the original publication that used TNX data from a different data provider. The symbol TNX used in this script represents actual yield and not the yield index.Tools and ideas for all Pine coders: tradingview.com/u/PineCoders/
Pine news broadcasts: t.me/PineCodersSquawkBox or twitter.com/PineCoders
TASC: traders.com/
Pine news broadcasts: t.me/PineCodersSquawkBox or twitter.com/PineCoders
TASC: traders.com/
면책사항
이 정보와 게시물은 TradingView에서 제공하거나 보증하는 금융, 투자, 거래 또는 기타 유형의 조언이나 권고 사항을 의미하거나 구성하지 않습니다. 자세한 내용은 이용 약관을 참고하세요.
Tools and ideas for all Pine coders: tradingview.com/u/PineCoders/
Pine news broadcasts: t.me/PineCodersSquawkBox or twitter.com/PineCoders
TASC: traders.com/
Pine news broadcasts: t.me/PineCodersSquawkBox or twitter.com/PineCoders
TASC: traders.com/
면책사항
이 정보와 게시물은 TradingView에서 제공하거나 보증하는 금융, 투자, 거래 또는 기타 유형의 조언이나 권고 사항을 의미하거나 구성하지 않습니다. 자세한 내용은 이용 약관을 참고하세요.