OPEN-SOURCE SCRIPT
SwRp – HTF Candle Box Overlay
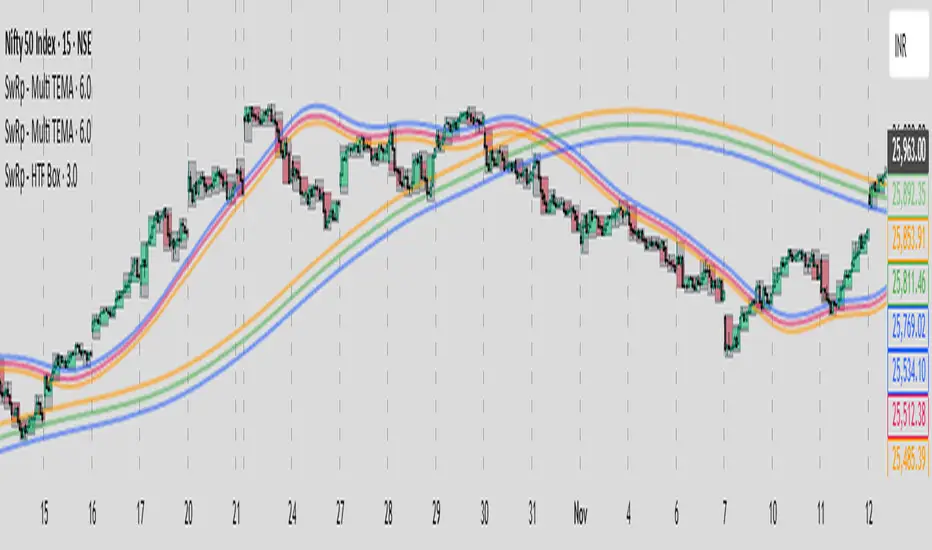
SwRp – HTF Candle Box Overlay gives you a clear visual map of higher-timeframe candles directly on your lower-timeframe chart. Instead of switching timeframes, you can see the structure of each HTF candle plotted as colored boxes that update in real time as the candle forms.
Each HTF candle is drawn using two elements:
• A wick box showing the full high-to-low range
• A body box showing the open-to-close move with automatic bull/bear coloring
Both boxes follow the exact HTF open, high, low and close values, and they stay correctly anchored to price using bar-time positioning. You can customize opacity, body/wick visibility, border color, and the number of HTF candles to keep on the chart. The indicator automatically removes older candles when they exceed your set limit, so the chart stays clean.
This tool is ideal for traders who want to see HTF structure, zones, and candle behavior while analyzing entries and exits on smaller timeframes.
Key Features
• Overlay higher-timeframe candles on lower-timeframe charts
• Real-time updating of HTF candle body and wick
• Bull/bear body coloring with full opacity controls
• Independent toggles for body and wick fills
• Automatically remove older HTF candles to keep the chart clean
• Accurate price anchoring using bar-time for all boxes
• No extra lines, labels, or clutter — a clean visual multi-timeframe view
This indicator offers a simple, clear way to track the behavior of higher-timeframe candles without leaving your current chart, helping you combine HTF context with LTF execution more effectively.
오픈 소스 스크립트
트레이딩뷰의 진정한 정신에 따라, 이 스크립트의 작성자는 이를 오픈소스로 공개하여 트레이더들이 기능을 검토하고 검증할 수 있도록 했습니다. 작성자에게 찬사를 보냅니다! 이 코드는 무료로 사용할 수 있지만, 코드를 재게시하는 경우 하우스 룰이 적용된다는 점을 기억하세요.
면책사항
해당 정보와 게시물은 금융, 투자, 트레이딩 또는 기타 유형의 조언이나 권장 사항으로 간주되지 않으며, 트레이딩뷰에서 제공하거나 보증하는 것이 아닙니다. 자세한 내용은 이용 약관을 참조하세요.
오픈 소스 스크립트
트레이딩뷰의 진정한 정신에 따라, 이 스크립트의 작성자는 이를 오픈소스로 공개하여 트레이더들이 기능을 검토하고 검증할 수 있도록 했습니다. 작성자에게 찬사를 보냅니다! 이 코드는 무료로 사용할 수 있지만, 코드를 재게시하는 경우 하우스 룰이 적용된다는 점을 기억하세요.
면책사항
해당 정보와 게시물은 금융, 투자, 트레이딩 또는 기타 유형의 조언이나 권장 사항으로 간주되지 않으며, 트레이딩뷰에서 제공하거나 보증하는 것이 아닙니다. 자세한 내용은 이용 약관을 참조하세요.