OPEN-SOURCE SCRIPT
Trend-Filter [John Ehlers]
Indicator Description — Trend-Filter [John Ehlers]
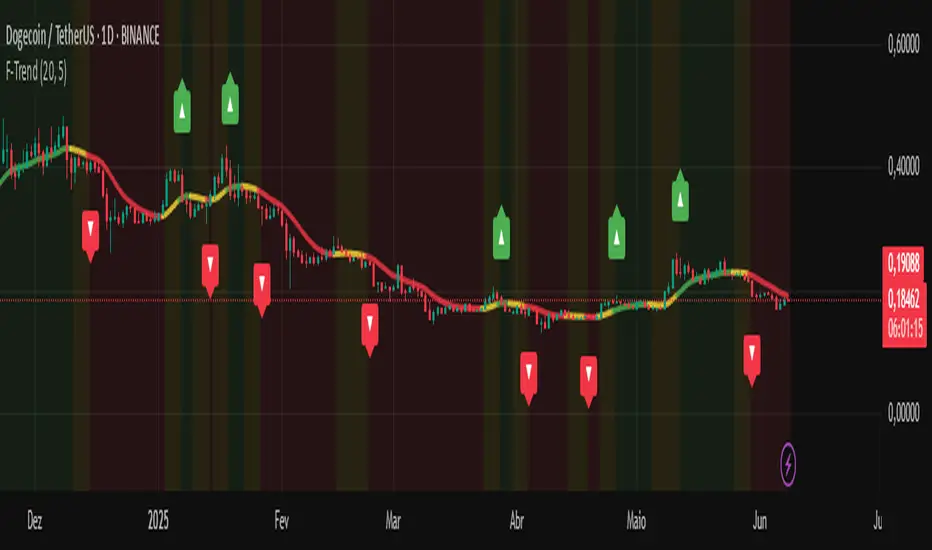
This indicator uses the SuperSmoother filter, created by John Ehlers, to smooth price data and identify trends with greater accuracy and less noise. It counts the number of consecutive bars in uptrend or downtrend to measure the strength of the movement and changes the line and background colors for easy visualization.
How to use this indicator:
SuperSmoother filter: smooths the price to reveal a clearer trend direction by filtering out fast oscillations and market noise.
Bar counting: monitors sequences of bars maintaining an up or down trend to identify consistent moves.
Dynamic colors:
Green line indicates a strong uptrend.
Red line indicates a strong downtrend.
Yellow line shows a neutral or undefined trend.
Optional colored background visually reinforces trend strength with transparency so it does not interfere with price reading.
Visual signals: arrows appear on the chart to mark the start of a strong trend, helping entry or exit decisions.
Adjustable parameters:
SuperSmoother Length: controls the filter smoothing (higher = smoother, less noise).
Trend Threshold: minimum number of consecutive bars to consider a strong trend.
Smooth colors: enable or disable line color smoothing.
Show signals: toggle trend start arrows on/off.
Show dynamic background: toggle the colored background indicating trend strength.
Recommendations:
Use alongside other technical analysis tools and risk management.
Can be applied on any timeframe, but interpretation is more reliable on charts with reasonable data volume.
Ideal for traders seeking to identify consistent trends and avoid market noise.
오픈 소스 스크립트
트레이딩뷰의 진정한 정신에 따라, 이 스크립트의 작성자는 이를 오픈소스로 공개하여 트레이더들이 기능을 검토하고 검증할 수 있도록 했습니다. 작성자에게 찬사를 보냅니다! 이 코드는 무료로 사용할 수 있지만, 코드를 재게시하는 경우 하우스 룰이 적용된다는 점을 기억하세요.
면책사항
해당 정보와 게시물은 금융, 투자, 트레이딩 또는 기타 유형의 조언이나 권장 사항으로 간주되지 않으며, 트레이딩뷰에서 제공하거나 보증하는 것이 아닙니다. 자세한 내용은 이용 약관을 참조하세요.
오픈 소스 스크립트
트레이딩뷰의 진정한 정신에 따라, 이 스크립트의 작성자는 이를 오픈소스로 공개하여 트레이더들이 기능을 검토하고 검증할 수 있도록 했습니다. 작성자에게 찬사를 보냅니다! 이 코드는 무료로 사용할 수 있지만, 코드를 재게시하는 경우 하우스 룰이 적용된다는 점을 기억하세요.
면책사항
해당 정보와 게시물은 금융, 투자, 트레이딩 또는 기타 유형의 조언이나 권장 사항으로 간주되지 않으며, 트레이딩뷰에서 제공하거나 보증하는 것이 아닙니다. 자세한 내용은 이용 약관을 참조하세요.