PROTECTED SOURCE SCRIPT
Order Flow Entry Quality Scanner
Order Flow Entry Quality Scanner
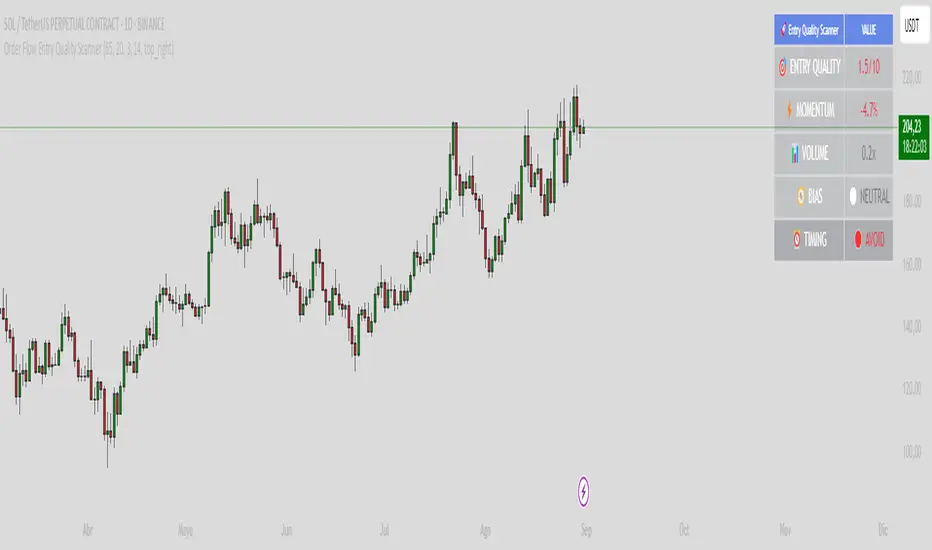
The order flow entry quality scanner is an educational technical analysis indicator designed to help traders evaluate the quality of potential entry points based on multiple technical factors. This indicator combines momentum, volume, delta analysis, and trend evaluation to provide an objective scoring system for market conditions.
Key Features
Comprehensive scoring system (0-10)
- momentum analysis: Evaluates price acceleration over recent bars
- volume delta: Measures buying vs selling pressure
- volume analysis: Compares current volume with historical averages
- vwap position: Determines price position relative to vwap
Advanced filters
- rsi filter: Optional to avoid overbought/oversold conditions
- value area filter: Helps identify fair price zones
- confluence analysis: Detects when multiple factors align
Clear visualization
- information table: Shows key metrics in real-time
- color coding: Intuitive system (green=favorable, yellow=caution, red=avoid)
- timing signals: Indicates when to consider, wait, or avoid entries
Configurable Parameters
Main configuration
- signal sensitivity (0-100): Adjusts overall scanner sensitivity
- volume periods(5-50): Defines period for volume analysis
- momentum bar (2-10): Number of bars for momentum calculation
Advanced filters
- rsi filter: Enable/disable rsi filtering
- rsi period (5-30): rsi period configuration
- value area filter: Enable value area analysis
Visual options
- show table: Enable/disable information table
- table position: Select chart location
Technical Calculations
Delta analysis
Calculates the difference between bullish and bearish volume based on tick direction to estimate buying/selling pressure.
Momentum acceleration
Measures the rate of price change over a specific period to identify acceleration or deceleration in movement.
Relative volume
Compares current volume with moving average to identify unusual activity.
Price efficiency
Evaluates how efficiently price moves within the bar's range.
Alert System
The indicator includes alerts for:
- High-quality bullish entries
- High-quality bearish entries
- Bullish factor confluence
- Bearish factor confluence
Recommended Usage
This indicator is an educational tool for technical analysis. It does not constitute financial advice nor guarantees results. Users should:
- Use it as part of a broader trading strategy
- Combine with other analysis methods
- Practice proper risk management
- Perform backtesting before live use
- Consider market conditions and fundamental news
Disclaimer
- educational purposes only: This indicator is designed for technical analysis learning
- no guarantees: Past results do not guarantee future performance
- risk warning: Trading involves risk of capital loss
- own decision: Trading decisions are solely the user's responsibility
- complementary analysis: Should be used alongside other analysis methods
- Works on all timeframes
- Compatible with all financial instruments
Always remember to do your own research and consult with financial professionals before making investment decisions.
보호된 스크립트입니다
이 스크립트는 비공개 소스로 게시됩니다. 하지만 이를 자유롭게 제한 없이 사용할 수 있습니다 – 자세한 내용은 여기에서 확인하세요.
면책사항
해당 정보와 게시물은 금융, 투자, 트레이딩 또는 기타 유형의 조언이나 권장 사항으로 간주되지 않으며, 트레이딩뷰에서 제공하거나 보증하는 것이 아닙니다. 자세한 내용은 이용 약관을 참조하세요.
면책사항
해당 정보와 게시물은 금융, 투자, 트레이딩 또는 기타 유형의 조언이나 권장 사항으로 간주되지 않으며, 트레이딩뷰에서 제공하거나 보증하는 것이 아닙니다. 자세한 내용은 이용 약관을 참조하세요.