INVITE-ONLY SCRIPT
업데이트됨 TREND CIRCLE + DIVERGENCES overlay
TCD INDICATOR SUPEROverlay includes circle trend instruments, divergence detection, and based on stochastic & high/low applications. Modification of this oscillator is of course to get better signals in the trading strategy. Make it as simple as possible. Glad to be informed that this indicator is NON-REPAINT.
Another instrument included is supply and demand (SnD, OrderBlock) to complete the technical to facilitate users in trading activities.
=========================================
This indicator strategy is not suitable for the forex, stock, and crude oil markets. It’s only tested on FCPO and CRYPTO(BTC, ETH, BNB) markets.
In fact, this indicator was built specifically for the Futures Crude Palm Oil ( FCPO ).
And it’s available for ANY TIMEFRAME. The selection of the time frame depends on the strategy. For example, the intraday strategy's appropriate time frame is 3M, 5M, and 15 minutes. For swing/overnight, 15M, 30M, 1H. The best-winning rates = 5M.
===========================================
The TCD INDICATOR ( wave trend ) follows swings in a volatile market which is why this particular indicator is very useful to identify the price at the bottom or the top and also be able to detect trend changes and divergences that occur.
Parameter that’s used
1. Stochastic Relative Strength Index
2. Moving Average ( Super Smooth)
3. Pivot point High-Low
4. Volume Threshold
==============================================
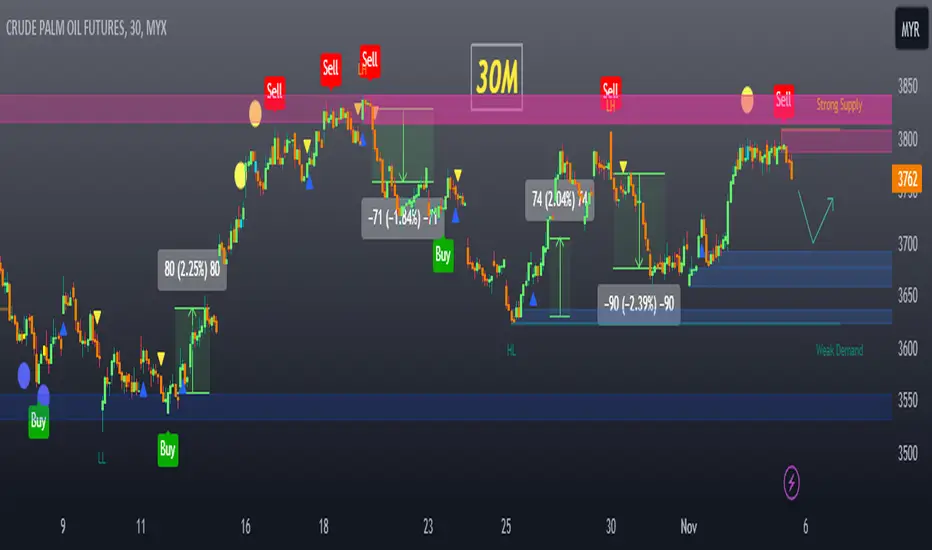
Key of indicator
a) Buy/Sell signals
= Regular divergence allows you to see a trend reversal or continuation. This is the
best signal to make decisions to sell short or buy long.
b) Blue/Yellow circles
= level of oversold/overbought. When it comes out, so trend potentially to reversal/changed.
Here we consider to buy/sell
c) Green/Red triangles
= They happen after oversold/overbought level. Here trend changes from the current trend.
It’s also for buy/sell signals for scalping.
d) Strong signals
= Strong buy/sell signals when both Red/Yellow circles and red Sell/green Buy
signals come out together. There is the best confirmation for the reversal of the
trend. Sometimes triangle signal also occurs. That was a Triple's signal.
e) Supply and Demand zone
= Blue line/background is supply zone and possibility for buy/target(TP) zone.
= Red line/background is demand zone and possibility for sell/target(TP) zone.
===============================================================
Display on the chart

Strong buy/sell

Day trading set-up

Swing set-up

DISCLAIMER:
All technical signals and strategies using this indicator are for educational purposes. Take it at your own risk.
Another instrument included is supply and demand (SnD, OrderBlock) to complete the technical to facilitate users in trading activities.
=========================================
This indicator strategy is not suitable for the forex, stock, and crude oil markets. It’s only tested on FCPO and CRYPTO(BTC, ETH, BNB) markets.
In fact, this indicator was built specifically for the Futures Crude Palm Oil ( FCPO ).
And it’s available for ANY TIMEFRAME. The selection of the time frame depends on the strategy. For example, the intraday strategy's appropriate time frame is 3M, 5M, and 15 minutes. For swing/overnight, 15M, 30M, 1H. The best-winning rates = 5M.
===========================================
The TCD INDICATOR ( wave trend ) follows swings in a volatile market which is why this particular indicator is very useful to identify the price at the bottom or the top and also be able to detect trend changes and divergences that occur.
Parameter that’s used
1. Stochastic Relative Strength Index
2. Moving Average ( Super Smooth)
3. Pivot point High-Low
4. Volume Threshold
==============================================
Key of indicator
a) Buy/Sell signals
= Regular divergence allows you to see a trend reversal or continuation. This is the
best signal to make decisions to sell short or buy long.
b) Blue/Yellow circles
= level of oversold/overbought. When it comes out, so trend potentially to reversal/changed.
Here we consider to buy/sell
c) Green/Red triangles
= They happen after oversold/overbought level. Here trend changes from the current trend.
It’s also for buy/sell signals for scalping.
d) Strong signals
= Strong buy/sell signals when both Red/Yellow circles and red Sell/green Buy
signals come out together. There is the best confirmation for the reversal of the
trend. Sometimes triangle signal also occurs. That was a Triple's signal.
e) Supply and Demand zone
= Blue line/background is supply zone and possibility for buy/target(TP) zone.
= Red line/background is demand zone and possibility for sell/target(TP) zone.
===============================================================
Display on the chart
Strong buy/sell
Day trading set-up
Swing set-up
DISCLAIMER:
All technical signals and strategies using this indicator are for educational purposes. Take it at your own risk.
릴리즈 노트
fixing the weak/strong zones릴리즈 노트
added alert for trend cross-up/down extra MA ( triangle signals)릴리즈 노트
Fix some errorsRemove plots that are stacked on the main chart
초대 전용 스크립트
이 스크립트는 작성자가 승인한 사용자만 접근할 수 있습니다. 사용하려면 요청 후 승인을 받아야 하며, 일반적으로 결제 후에 허가가 부여됩니다. 자세한 내용은 아래 작성자의 안내를 따르거나 TraderAsist에게 직접 문의하세요.
이 비공개 초대 전용 스크립트는 스크립트 모더레이터의 검토를 거치지 않았으며, 하우스 룰 준수 여부는 확인되지 않았습니다. 트레이딩뷰는 스크립트의 작동 방식을 충분히 이해하고 작성자를 완전히 신뢰하지 않는 이상, 해당 스크립트에 비용을 지불하거나 사용하는 것을 권장하지 않습니다. 커뮤니티 스크립트에서 무료 오픈소스 대안을 찾아보실 수도 있습니다.
작성자 지시 사항
Please contact admin for more information.
면책사항
해당 정보와 게시물은 금융, 투자, 트레이딩 또는 기타 유형의 조언이나 권장 사항으로 간주되지 않으며, 트레이딩뷰에서 제공하거나 보증하는 것이 아닙니다. 자세한 내용은 이용 약관을 참조하세요.