OPEN-SOURCE SCRIPT
업데이트됨 Dynamic Gradient Filter
Sigmoid Functions:
[d1]History and Mathematical Basis:[/d1]
- Sigmoid functions have a rich history in mathematics and are widely used in various fields, including statistics, machine learning, and signal processing.
- The term "sigmoid" originates from the Greek words "sigma" (meaning "S-shaped") and "eidos" (meaning "form" or "type").
- The sigmoid curve is characterized by its smooth S-shaped appearance, which allows it to map any real-valued input to a bounded output range, typically between 0 and 1.
- The most common form of the sigmoid function is the logistic function:
[d1]Logistic Function (σ):[/d1]
- Defined as σ(x) = 1 / (1 + e^(-x)), where:
'x' is the input value,
'e' is Euler's number (approximately 2.71828).
- This function was first introduced by Belgian mathematician Pierre François Verhulst in the 1830s to model population growth with limiting factors.
- It gained popularity in the early 20th century when statisticians like Ronald Fisher began using it in regression analysis.
Specific Sigmoid Functions Used in the Indicator:
- sig(val):
The 'sig' function in this indicator is a modified version of the logistic function, clamping a value between 0 and 1 on the sigmoid curve.
- siga(val):
The 'siga' function adjusts values between -1 and 1 on the sigmoid curve, offering a centered variation of the sigmoid effect.
- sigmoid(val):
The 'sigmoid' function provides a standard implementation of the logistic function, calculating the sigmoid value of the input data.
Adaptive Smoothing Factor:
The 'adaptiveSmoothingFactor(gradient, k)' function computes a dynamic smoothing factor for the filter based on the gradient of the price data and the user-defined sensitivity parameter 'k'.
- Gradient:
The gradient represents the rate of change in price, calculated as the absolute difference between the current and previous close prices.
- Sensitivity (k):
The 'k' parameter adjusts how quickly the filter reacts to changes in the gradient. Higher values of 'k' lead to a more responsive filter, while lower values result in smoother outputs.
Usage in the Indicator:
The "close" value refers to the closing price of each period in the chart's time frame
- The indicator calculates the gradient by measuring the absolute difference between the current "close" price and the previous "close" price.
- This gradient represents the strength or magnitude of the price movement within the chosen time frame.
- The "close" value plays a pivotal role in determining the dynamic behavior of the "Dynamic Gradient Filter," as it directly influences the smoothing factor.
What Makes This Special:
The "Dynamic Gradient Filter" indicator stands out due to its adaptive nature and responsiveness to changing market conditions.
Dynamic Smoothing Factor:
- The indicator's dynamic smoothing factor adjusts in real-time based on the rate of change in price (gradient) and the user-defined sensitivity '(k)' parameter.
- This adaptability allows the filter to respond promptly to both minor fluctuations and significant price movements.
Smoothed Price Action:
- The final output of the filter is a smoothed representation of the price action, aiding traders in identifying trends and potential reversals.
Customizable Sensitivity:
- Traders can adjust the 'Sensitivity' parameter '(k)' to suit their preferred trading style, making the indicator versatile for various strategies.
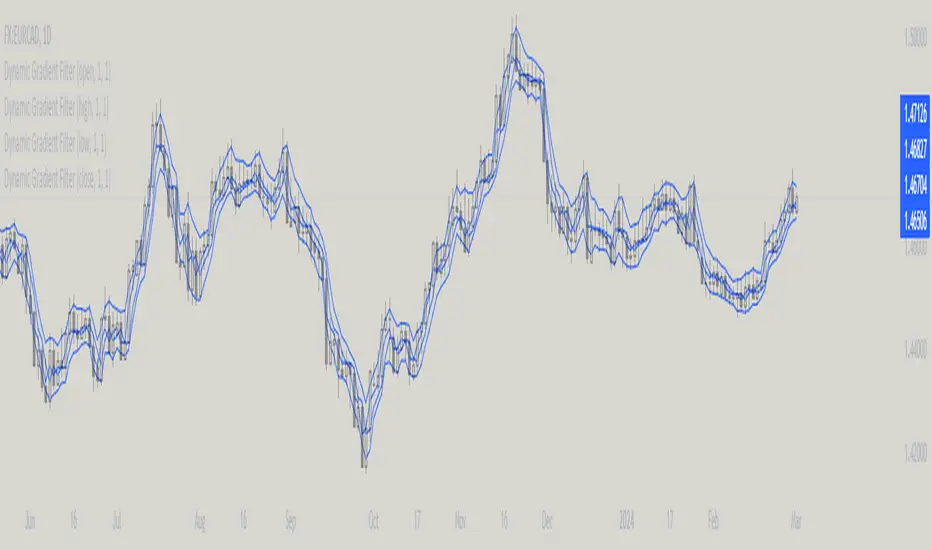
Visual Clarity:
- The plotted "Dynamic Gradient Filter" line on the chart provides a clear visual guide, enhancing the understanding of market dynamics.
Usage:
Traders and analysts can utilize the "Dynamic Gradient Filter" to:
- Identify trends and reversals in price movements.
- Filter out noise and highlight significant price changes.
- Fine-tune trading strategies by adjusting the sensitivity parameter.
- Enhance visual analysis with a dynamically adjusting filter line on the chart.
Literature:
- https://en.wikipedia.org/wiki/Pierre_Fran%C3%A7ois_Verhulst
- https://medium.com/in-maths-garden-with-julia/behind-the-logistic-function-47a8430a8f46
- https://en.wikipedia.org/wiki/Sigmoid_function
릴리즈 노트
minor adjustment tom = input.float(1, title="Multiplier",minval=0.01, maxval=10000, step=0.01)
오픈 소스 스크립트
트레이딩뷰의 진정한 정신에 따라, 이 스크립트의 작성자는 이를 오픈소스로 공개하여 트레이더들이 기능을 검토하고 검증할 수 있도록 했습니다. 작성자에게 찬사를 보냅니다! 이 코드는 무료로 사용할 수 있지만, 코드를 재게시하는 경우 하우스 룰이 적용된다는 점을 기억하세요.
Mupsje aka Casatropical
면책사항
해당 정보와 게시물은 금융, 투자, 트레이딩 또는 기타 유형의 조언이나 권장 사항으로 간주되지 않으며, 트레이딩뷰에서 제공하거나 보증하는 것이 아닙니다. 자세한 내용은 이용 약관을 참조하세요.
오픈 소스 스크립트
트레이딩뷰의 진정한 정신에 따라, 이 스크립트의 작성자는 이를 오픈소스로 공개하여 트레이더들이 기능을 검토하고 검증할 수 있도록 했습니다. 작성자에게 찬사를 보냅니다! 이 코드는 무료로 사용할 수 있지만, 코드를 재게시하는 경우 하우스 룰이 적용된다는 점을 기억하세요.
Mupsje aka Casatropical
면책사항
해당 정보와 게시물은 금융, 투자, 트레이딩 또는 기타 유형의 조언이나 권장 사항으로 간주되지 않으며, 트레이딩뷰에서 제공하거나 보증하는 것이 아닙니다. 자세한 내용은 이용 약관을 참조하세요.