OPEN-SOURCE SCRIPT
업데이트됨 Quantum Flow Tracker
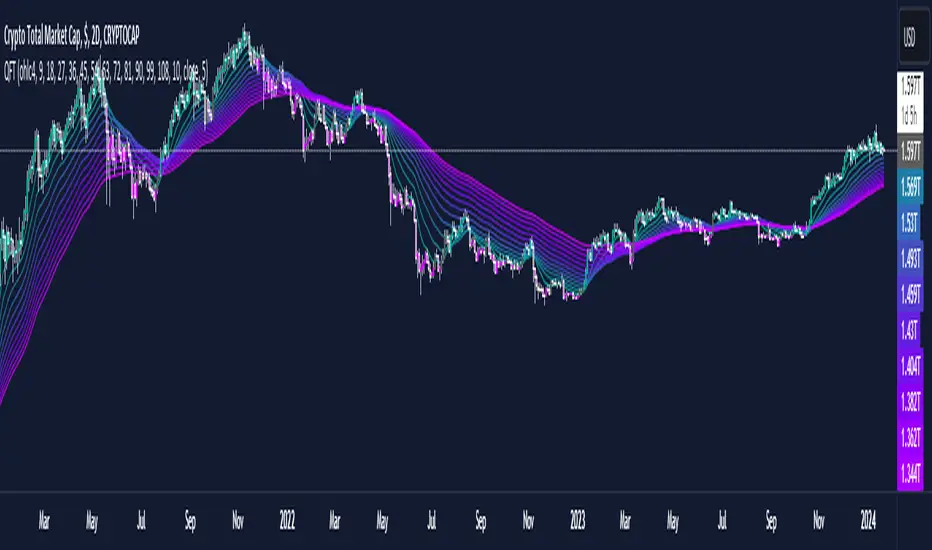
This indicator is designed to capture trends in financial markets by utilizing an Exponential Moving Average (EMA) and the Relative Strength Index (RSI).
Multiple EMAs
The indicator plots multiple EMAs with varying lengths on the chart. Users can customize the lengths of these EMAs using the input parameters.
RSI (Relative Strength Index)
The RSI is calculated based on user-defined length and source inputs.
Additionally, the RSI is smoothed using an Exponential Moving Average (EMA) with a customizable length.
Trend Conditions
The indicator defines uptrend and downtrend conditions based on the relationship between the closing price, the first EMA and the EMA of RSI .
An uptrend (Green Color) is identified when the closing price is above ema1 and the smoothed RSI is above 50.
A downtrend (Purple Color) is identified when the closing price is below ema1 and the smoothed RSI is below 50.
A neutral state (Gray Color) suggests that the trend may be weakening, potentially indicating a forthcoming trend reversal or a period of indecision in the market.
This indicator provides a visual representation of trend directions and can be customized to adjust the sensitivity and frequency of trend changes.
Disclaimer: This indicator is provided for educational and informational purposes only.
It is not intended as financial advice or as a tool for making financial decisions.
Users are advised to conduct their own research and seek the advice of a qualified financial professional before making any investment decisions. The creator of this indicator is not responsible for any financial losses incurred as a result of using this indicator.
릴리즈 노트
Default values for the EMAs error changed.오픈 소스 스크립트
트레이딩뷰의 진정한 정신에 따라, 이 스크립트의 작성자는 이를 오픈소스로 공개하여 트레이더들이 기능을 검토하고 검증할 수 있도록 했습니다. 작성자에게 찬사를 보냅니다! 이 코드는 무료로 사용할 수 있지만, 코드를 재게시하는 경우 하우스 룰이 적용된다는 점을 기억하세요.
🔍 Access Investing Strategies & Indicators
📊 whop.com/marktquant
🌐 marktquant.com
Nothing shared on this page constitutes financial advice. All information, tools, and analyses are provided solely for informational and educational purposes.
📊 whop.com/marktquant
🌐 marktquant.com
Nothing shared on this page constitutes financial advice. All information, tools, and analyses are provided solely for informational and educational purposes.
면책사항
해당 정보와 게시물은 금융, 투자, 트레이딩 또는 기타 유형의 조언이나 권장 사항으로 간주되지 않으며, 트레이딩뷰에서 제공하거나 보증하는 것이 아닙니다. 자세한 내용은 이용 약관을 참조하세요.
오픈 소스 스크립트
트레이딩뷰의 진정한 정신에 따라, 이 스크립트의 작성자는 이를 오픈소스로 공개하여 트레이더들이 기능을 검토하고 검증할 수 있도록 했습니다. 작성자에게 찬사를 보냅니다! 이 코드는 무료로 사용할 수 있지만, 코드를 재게시하는 경우 하우스 룰이 적용된다는 점을 기억하세요.
🔍 Access Investing Strategies & Indicators
📊 whop.com/marktquant
🌐 marktquant.com
Nothing shared on this page constitutes financial advice. All information, tools, and analyses are provided solely for informational and educational purposes.
📊 whop.com/marktquant
🌐 marktquant.com
Nothing shared on this page constitutes financial advice. All information, tools, and analyses are provided solely for informational and educational purposes.
면책사항
해당 정보와 게시물은 금융, 투자, 트레이딩 또는 기타 유형의 조언이나 권장 사항으로 간주되지 않으며, 트레이딩뷰에서 제공하거나 보증하는 것이 아닙니다. 자세한 내용은 이용 약관을 참조하세요.