INVITE-ONLY SCRIPT
Market Sentiment Indicator
Market Sentiment Indicator
Class: hybrid – trend oscillator
Trading type: any
Time frame: any
Purpose: trend detection, reverse points detection
Level of aggressiveness: any
Indicator «Market Sentiment Indicator» (MSI) is used to detect dominating market sentiments and to search for the points of market sentiments change.
Domination of bullish sentiments means that “buy” trades are preferable. In case of bearish sentiments “sell” trades should prevail. Also indicator “MSI” can detect neutral market sentiments (the absence of dominating tendency), which means the presence of flat in the price dynamics.
Entering the extreme zones means that current market sentiments may change soon. This may act as a reverse signal.
Summarizing «Market Sentiment Indicator» provides additional information for successful trading.
Structure of the indicator
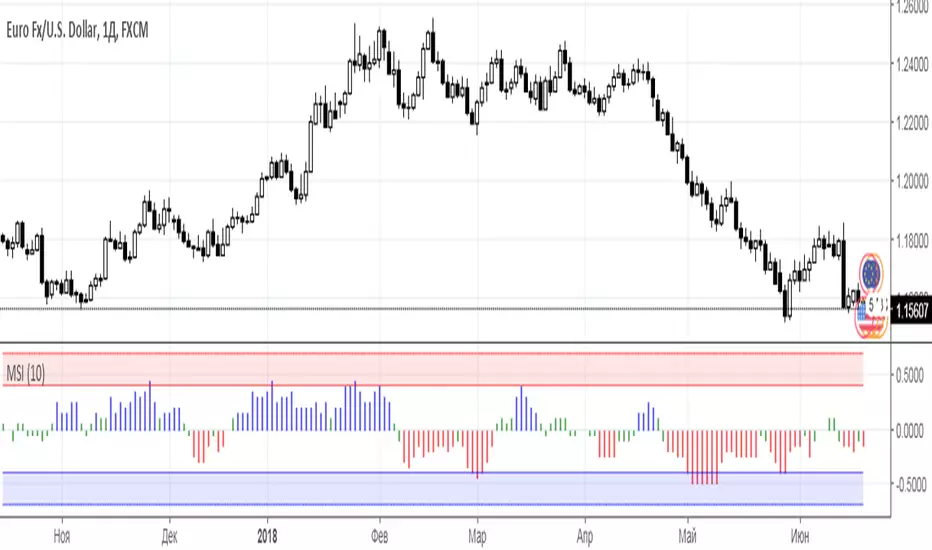
Indicator consists of the following elements:
- Histogram of market sentiments – is presented with 3 color gammas: blue color (bullish sentiments are dominating), red color (bearish sentiments are dominating), red color (neutral sentiments are present in the market),
- Red zone – bullish extreme zone, warns that current upward trend is ready for correction. Entering this zone is a signal for partial profit fixation for long positions;
- Blue zone – bearish extreme zone, warns that current downward trend is ready for correction. Entering this zone is a signal for partial profit fixation for short positions.
Input parameters of the indicator
To set up the indicator a “MSI period” parameter is used. It shows how many previous periods are used to calculate the MSI. The bigger the period is the more conservative signals are and vice versa.
Rules of trading
The main purpose of this indicator is detection of prevailing market sentiments: bullish (blue color of histogram), bearish (red color of histogram) and neutral (green color of histogram).
Accordingly in case of bulls’ domination preference should be given to purchases, in the bear market – to sell trades. Neutral state of the market is a reason to trade with no any preferences.
Entering the extreme zones is a reason for partial profit fixation of positions opened in current tendency.
Exit from the extreme zones is a strong reversal signal.
Class: hybrid – trend oscillator
Trading type: any
Time frame: any
Purpose: trend detection, reverse points detection
Level of aggressiveness: any
Indicator «Market Sentiment Indicator» (MSI) is used to detect dominating market sentiments and to search for the points of market sentiments change.
Domination of bullish sentiments means that “buy” trades are preferable. In case of bearish sentiments “sell” trades should prevail. Also indicator “MSI” can detect neutral market sentiments (the absence of dominating tendency), which means the presence of flat in the price dynamics.
Entering the extreme zones means that current market sentiments may change soon. This may act as a reverse signal.
Summarizing «Market Sentiment Indicator» provides additional information for successful trading.
Structure of the indicator
Indicator consists of the following elements:
- Histogram of market sentiments – is presented with 3 color gammas: blue color (bullish sentiments are dominating), red color (bearish sentiments are dominating), red color (neutral sentiments are present in the market),
- Red zone – bullish extreme zone, warns that current upward trend is ready for correction. Entering this zone is a signal for partial profit fixation for long positions;
- Blue zone – bearish extreme zone, warns that current downward trend is ready for correction. Entering this zone is a signal for partial profit fixation for short positions.
Input parameters of the indicator
To set up the indicator a “MSI period” parameter is used. It shows how many previous periods are used to calculate the MSI. The bigger the period is the more conservative signals are and vice versa.
Rules of trading
The main purpose of this indicator is detection of prevailing market sentiments: bullish (blue color of histogram), bearish (red color of histogram) and neutral (green color of histogram).
Accordingly in case of bulls’ domination preference should be given to purchases, in the bear market – to sell trades. Neutral state of the market is a reason to trade with no any preferences.
Entering the extreme zones is a reason for partial profit fixation of positions opened in current tendency.
Exit from the extreme zones is a strong reversal signal.
초대 전용 스크립트
이 스크립트는 작성자가 승인한 사용자만 접근할 수 있습니다. 사용하려면 요청을 보내고 승인을 받아야 합니다. 일반적으로 결제 후에 승인이 이루어집니다. 자세한 내용은 아래 작성자의 지침을 따르거나 Trade24Fx에게 직접 문의하세요.
트레이딩뷰는 스크립트 작성자를 완전히 신뢰하고 스크립트 작동 방식을 이해하지 않는 한 스크립트 비용을 지불하거나 사용하지 않는 것을 권장하지 않습니다. 무료 오픈소스 대체 스크립트는 커뮤니티 스크립트에서 찾을 수 있습니다.
작성자 지시 사항
Авторские индикаторы
bit.ly/2oBvkHY
Больше информации на нашем ютьюб-канале
youtube.com/channel/UCYEOurJfasXWyYnrriGwsqQ
bit.ly/2oBvkHY
Больше информации на нашем ютьюб-канале
youtube.com/channel/UCYEOurJfasXWyYnrriGwsqQ
면책사항
이 정보와 게시물은 TradingView에서 제공하거나 보증하는 금융, 투자, 거래 또는 기타 유형의 조언이나 권고 사항을 의미하거나 구성하지 않습니다. 자세한 내용은 이용 약관을 참고하세요.