OPEN-SOURCE SCRIPT
업데이트됨 EMA 9/45/90/180/270/360 Reversals

Hey!
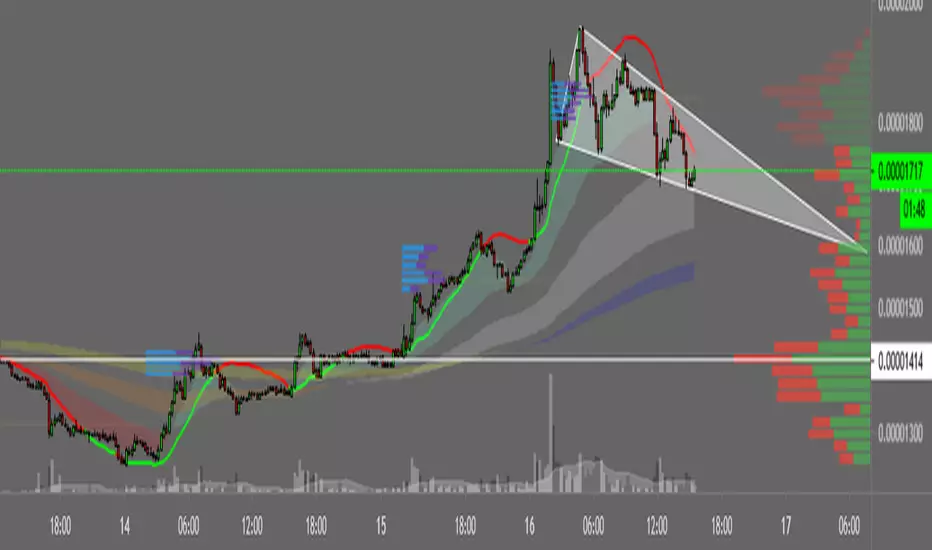
This is a 6EMA crossover script, to make a whole trend and S/R analysis in a second ;)
Hope you like it! Leave a like pls :)
This is a 6EMA crossover script, to make a whole trend and S/R analysis in a second ;)
Hope you like it! Leave a like pls :)
릴리즈 노트
UPDATE:#Change in colours: I think these are kinda better.
#Added SD*3 from de EMA9 (Green plot): Works as a delayed Lower Bollinger Band. My invention :)
TIPS: You can unfill the zones, and give more opacy to EMAs. I cannot untick them, but I can do give them 100% transparency.
Also, you can untick the SD*3 recently added.
Soon more updates :)
릴리즈 노트
UPDATE:#Added Linear Regression and crossover with price colour change. This gives a clear idea of the trend.
Price above LR = Bullish
Price below LR = Bearish
I turned TL1-TD*3 to 100% transparency, but you can turn it on if you liked it.
Leave me suggestions!
Thanks for support.
오픈 소스 스크립트
트레이딩뷰의 진정한 정신에 따라, 이 스크립트의 작성자는 이를 오픈소스로 공개하여 트레이더들이 기능을 검토하고 검증할 수 있도록 했습니다. 작성자에게 찬사를 보냅니다! 이 코드는 무료로 사용할 수 있지만, 코드를 재게시하는 경우 하우스 룰이 적용된다는 점을 기억하세요.
면책사항
해당 정보와 게시물은 금융, 투자, 트레이딩 또는 기타 유형의 조언이나 권장 사항으로 간주되지 않으며, 트레이딩뷰에서 제공하거나 보증하는 것이 아닙니다. 자세한 내용은 이용 약관을 참조하세요.
오픈 소스 스크립트
트레이딩뷰의 진정한 정신에 따라, 이 스크립트의 작성자는 이를 오픈소스로 공개하여 트레이더들이 기능을 검토하고 검증할 수 있도록 했습니다. 작성자에게 찬사를 보냅니다! 이 코드는 무료로 사용할 수 있지만, 코드를 재게시하는 경우 하우스 룰이 적용된다는 점을 기억하세요.
면책사항
해당 정보와 게시물은 금융, 투자, 트레이딩 또는 기타 유형의 조언이나 권장 사항으로 간주되지 않으며, 트레이딩뷰에서 제공하거나 보증하는 것이 아닙니다. 자세한 내용은 이용 약관을 참조하세요.