OPEN-SOURCE SCRIPT
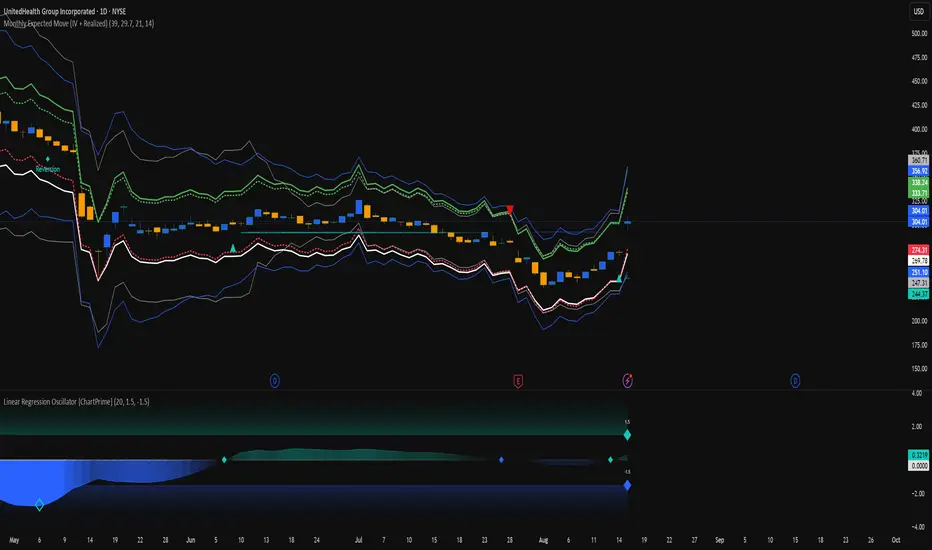
Monthly Expected Move (IV + Realized)
What it does
Overlays 1-month expected move bands on price using both forward-looking options data and backward-looking realized movement:
IV30 band — from your pasted 30-day implied vol (%)
Straddle band — from your pasted ATM ~30-DTE call+put total
HV band — from Historical Volatility computed on-chart
ATR band — from ATR% extrapolated to ~1 trading month
Use it to quickly answer: “How much could this stock move in ~1 month?” and “Is the market now pricing more/less movement than we’ve actually been getting?”
Inputs (quick)
Implied (forward-looking)
Use IV30 (%) — paste annualized IV30 from your options platform.
Use ATM 30-DTE Straddle — paste Call+Put total (per share) at the ATM strike, ~30 DTE.
Realized (backward-looking)
HV lookback (days) — default 21 (≈1 trading month).
ATR length — default 14.
Note: TradingView can’t fetch option data automatically. Paste the IV30 % or the straddle total you read from your broker (use Mark/mid prices).
How it’s calculated
IV band (±%) = IV30 × √(21/252) (annualized → ~1-month).
Straddle band (±%) = (ATM Call + Put) / Spot to that expiry (≈30 DTE).
HV band (±%) = stdev(log returns, N) × √252 × √(21/252).
ATR band (±%) = (ATR(len)/Close) × √21.
All bands are plotted as upper/lower envelopes around price, plus an on-chart readout of each ±% for quick scanning.
How to use it (at a glance)
IV/Straddle bands wider than HV/ATR → market expects bigger movement than recent actuals (possible catalyst/expansion).
All bands narrow → likely a low-mover; look elsewhere if you want action.
HV > IV → realized swings exceed current pricing (mean-reversion or vol bleed often follows).
Pro tips
For ATM straddle: pick the expiry closest to ~30 DTE, use the ATM strike (closest to spot), and add Call Mark + Put Mark (per share). If the exact ATM strike isn’t quoted, average the two neighboring strikes.
The simple straddle/spot heuristic can read slightly below the IV-derived 1σ; that’s normal.
Keep the chart on daily timeframe—the math assumes trading-day conventions (~252/yr, ~21/mo).
오픈 소스 스크립트
트레이딩뷰의 진정한 정신에 따라, 이 스크립트의 작성자는 이를 오픈소스로 공개하여 트레이더들이 기능을 검토하고 검증할 수 있도록 했습니다. 작성자에게 찬사를 보냅니다! 이 코드는 무료로 사용할 수 있지만, 코드를 재게시하는 경우 하우스 룰이 적용된다는 점을 기억하세요.
면책사항
해당 정보와 게시물은 금융, 투자, 트레이딩 또는 기타 유형의 조언이나 권장 사항으로 간주되지 않으며, 트레이딩뷰에서 제공하거나 보증하는 것이 아닙니다. 자세한 내용은 이용 약관을 참조하세요.
오픈 소스 스크립트
트레이딩뷰의 진정한 정신에 따라, 이 스크립트의 작성자는 이를 오픈소스로 공개하여 트레이더들이 기능을 검토하고 검증할 수 있도록 했습니다. 작성자에게 찬사를 보냅니다! 이 코드는 무료로 사용할 수 있지만, 코드를 재게시하는 경우 하우스 룰이 적용된다는 점을 기억하세요.
면책사항
해당 정보와 게시물은 금융, 투자, 트레이딩 또는 기타 유형의 조언이나 권장 사항으로 간주되지 않으며, 트레이딩뷰에서 제공하거나 보증하는 것이 아닙니다. 자세한 내용은 이용 약관을 참조하세요.