OPEN-SOURCE SCRIPT
업데이트됨 Mean Reversion Dots
Markets tend to mean revert. This indicator plots a moving average from a higher time frame (type of MA and length selectable by the user). It then calculates standard deviations in two dimensions:
- Standard deviation of move of price away from this moving average
- Standard deviations of number of bars spent in this extended range
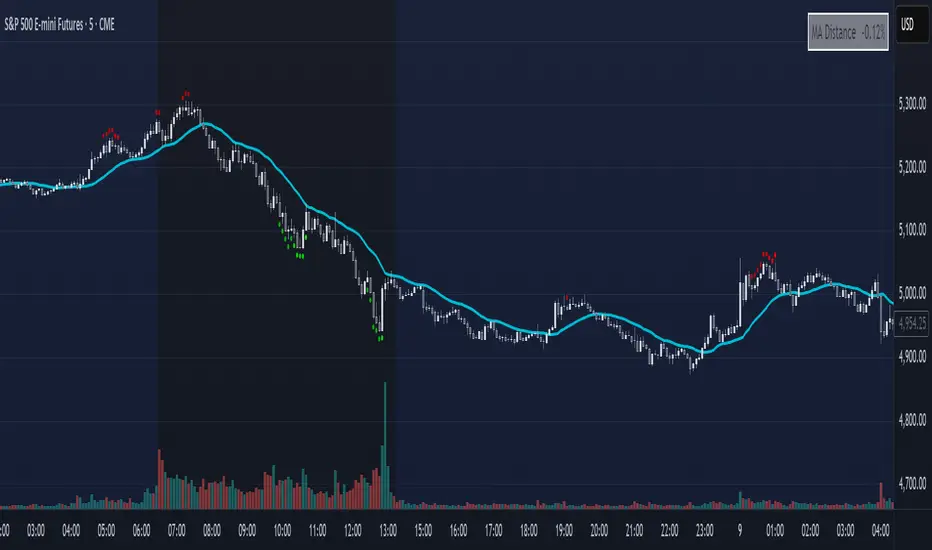
The indicator plots a table in the upper right corner with the % of distance of price from the moving average. It then plots 'mean reversion dots' once price has been 1 or more standard deviations away from the moving average for one or more standard deviations number of bars. The dots change color, becoming more intense, the longer the move persists. Optionally, the user can display the standard deviations in movement away from the moving average as channels, and the user can also select which levels of moves they want to see. Opting to see only more extreme moves will result in fewer signals, but signals that are more likely to imminently result in mean reversion back to the moving average.
In my opinion, this indicator is more likely to be useful for indices, futures, commodities, and select larger cap names.
Combinations I have found that work well for SPX are plotting the 30min 21ema on a 5min chart and the daily 21ema on an hourly chart.
In many cases, once mean reversion dots for an extreme enough move (level 1.3 or 2.2 and above) begin to appear, a trade may be initiated from a support/resistance level. A safer way to use these signals is to consider them as a 'heads up' that the move is overextended, and then look for a buy/sell signal from another indicator to initiate a position.
Note: I borrowed the code for the higher timeframe MA from the below indicator. I added the ability to select type of MA.
- Standard deviation of move of price away from this moving average
- Standard deviations of number of bars spent in this extended range
The indicator plots a table in the upper right corner with the % of distance of price from the moving average. It then plots 'mean reversion dots' once price has been 1 or more standard deviations away from the moving average for one or more standard deviations number of bars. The dots change color, becoming more intense, the longer the move persists. Optionally, the user can display the standard deviations in movement away from the moving average as channels, and the user can also select which levels of moves they want to see. Opting to see only more extreme moves will result in fewer signals, but signals that are more likely to imminently result in mean reversion back to the moving average.
In my opinion, this indicator is more likely to be useful for indices, futures, commodities, and select larger cap names.
Combinations I have found that work well for SPX are plotting the 30min 21ema on a 5min chart and the daily 21ema on an hourly chart.
In many cases, once mean reversion dots for an extreme enough move (level 1.3 or 2.2 and above) begin to appear, a trade may be initiated from a support/resistance level. A safer way to use these signals is to consider them as a 'heads up' that the move is overextended, and then look for a buy/sell signal from another indicator to initiate a position.
Note: I borrowed the code for the higher timeframe MA from the below indicator. I added the ability to select type of MA.
릴리즈 노트
A long overdue update to this indicator, this update does some code cleanup as well as makes the following minor but helpful changes.- Default source value is now 'open' rather than close. This avoids the possibility of repainting when a higher timeframe rather than the chart moving average is used. If using on the chart timeframe.
- Turns off by default some of the lower level dots which are lower probability to result in mean reversion.
- Adds options for alerts on first reversion dot, either of a specified degree, or whatever the lowest threshold the user has enabled.
오픈 소스 스크립트
트레이딩뷰의 진정한 정신에 따라, 이 스크립트의 작성자는 이를 오픈소스로 공개하여 트레이더들이 기능을 검토하고 검증할 수 있도록 했습니다. 작성자에게 찬사를 보냅니다! 이 코드는 무료로 사용할 수 있지만, 코드를 재게시하는 경우 하우스 룰이 적용된다는 점을 기억하세요.
면책사항
해당 정보와 게시물은 금융, 투자, 트레이딩 또는 기타 유형의 조언이나 권장 사항으로 간주되지 않으며, 트레이딩뷰에서 제공하거나 보증하는 것이 아닙니다. 자세한 내용은 이용 약관을 참조하세요.
오픈 소스 스크립트
트레이딩뷰의 진정한 정신에 따라, 이 스크립트의 작성자는 이를 오픈소스로 공개하여 트레이더들이 기능을 검토하고 검증할 수 있도록 했습니다. 작성자에게 찬사를 보냅니다! 이 코드는 무료로 사용할 수 있지만, 코드를 재게시하는 경우 하우스 룰이 적용된다는 점을 기억하세요.
면책사항
해당 정보와 게시물은 금융, 투자, 트레이딩 또는 기타 유형의 조언이나 권장 사항으로 간주되지 않으며, 트레이딩뷰에서 제공하거나 보증하는 것이 아닙니다. 자세한 내용은 이용 약관을 참조하세요.