OPEN-SOURCE SCRIPT
업데이트됨 Average True Range Level
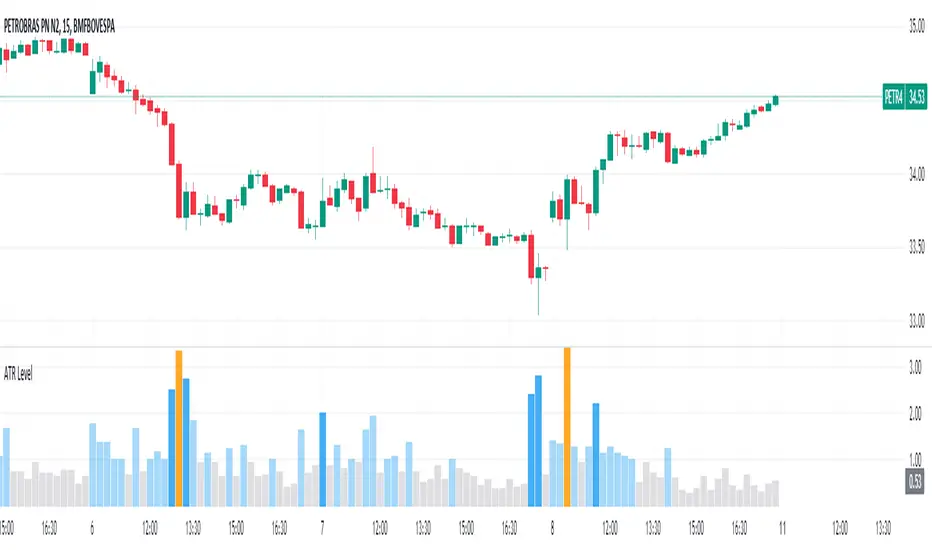
█ Overview
The indicator uses color-coded columns to represent different levels of normalized ATR, helping traders identify periods of high or low volatility.
█ Calculations
The normalization process involves dividing the current True Range by the Average True Range. The formula for normalized ATR in the code is:
Pine Script®
█ How To Use
Level < 1
During periods when the normalized ATR is less than 1, suggesting a lower level of volatility, traders may explore inside bar strategies. These strategies focus on trading within the range of the previous bar, aiming to capitalize on potential breakout opportunities.
Level between 1 and 3
In instances where the normalized ATR falls between 1 and 3, indicating moderate volatility, a pullback strategy may be considered. Traders look for temporary corrections against the prevailing trend, entering positions in anticipation of the trend's resumption
Level between 2 and 3
Within the range of normalized ATR between 2 and 3, signifying a balanced level of volatility, traders might explore breakout strategies. These strategies involve identifying potential breakout levels using support and resistance or other indicators and entering trades in the direction of the breakout.
Level > 3
When the normalized ATR exceeds 3, signaling high volatility, traders should approach with caution. While not ideal for typical mean reversion strategies, this condition may indicate that the price has become overextended. Traders might wait for subsequent candles, observing a normalized ATR between 2 and 3, to consider mean reversion opportunities after potential overpricing during the high volatility period.
* Note: These strategies are suggestions and may not be suitable for all trading scenarios. Traders should exercise discretion, conduct their own analysis, and adapt strategies based on individual preferences and risk tolerance.
The indicator uses color-coded columns to represent different levels of normalized ATR, helping traders identify periods of high or low volatility.
█ Calculations
The normalization process involves dividing the current True Range by the Average True Range. The formula for normalized ATR in the code is:
nAtr = nz(barRange/atr)
█ How To Use
Level < 1
During periods when the normalized ATR is less than 1, suggesting a lower level of volatility, traders may explore inside bar strategies. These strategies focus on trading within the range of the previous bar, aiming to capitalize on potential breakout opportunities.
Level between 1 and 3
In instances where the normalized ATR falls between 1 and 3, indicating moderate volatility, a pullback strategy may be considered. Traders look for temporary corrections against the prevailing trend, entering positions in anticipation of the trend's resumption
Level between 2 and 3
Within the range of normalized ATR between 2 and 3, signifying a balanced level of volatility, traders might explore breakout strategies. These strategies involve identifying potential breakout levels using support and resistance or other indicators and entering trades in the direction of the breakout.
Level > 3
When the normalized ATR exceeds 3, signaling high volatility, traders should approach with caution. While not ideal for typical mean reversion strategies, this condition may indicate that the price has become overextended. Traders might wait for subsequent candles, observing a normalized ATR between 2 and 3, to consider mean reversion opportunities after potential overpricing during the high volatility period.
* Note: These strategies are suggestions and may not be suitable for all trading scenarios. Traders should exercise discretion, conduct their own analysis, and adapt strategies based on individual preferences and risk tolerance.
릴리즈 노트
New input: include or exclude any gaps in current bar range calculation.릴리즈 노트
Added ATR Smoothing Input.Added rounding to the symbol's mintick in the normalized ATR calculation.
오픈 소스 스크립트
트레이딩뷰의 진정한 정신에 따라, 이 스크립트의 작성자는 이를 오픈소스로 공개하여 트레이더들이 기능을 검토하고 검증할 수 있도록 했습니다. 작성자에게 찬사를 보냅니다! 이 코드는 무료로 사용할 수 있지만, 코드를 재게시하는 경우 하우스 룰이 적용된다는 점을 기억하세요.
면책사항
해당 정보와 게시물은 금융, 투자, 트레이딩 또는 기타 유형의 조언이나 권장 사항으로 간주되지 않으며, 트레이딩뷰에서 제공하거나 보증하는 것이 아닙니다. 자세한 내용은 이용 약관을 참조하세요.
오픈 소스 스크립트
트레이딩뷰의 진정한 정신에 따라, 이 스크립트의 작성자는 이를 오픈소스로 공개하여 트레이더들이 기능을 검토하고 검증할 수 있도록 했습니다. 작성자에게 찬사를 보냅니다! 이 코드는 무료로 사용할 수 있지만, 코드를 재게시하는 경우 하우스 룰이 적용된다는 점을 기억하세요.
면책사항
해당 정보와 게시물은 금융, 투자, 트레이딩 또는 기타 유형의 조언이나 권장 사항으로 간주되지 않으며, 트레이딩뷰에서 제공하거나 보증하는 것이 아닙니다. 자세한 내용은 이용 약관을 참조하세요.