OPEN-SOURCE SCRIPT
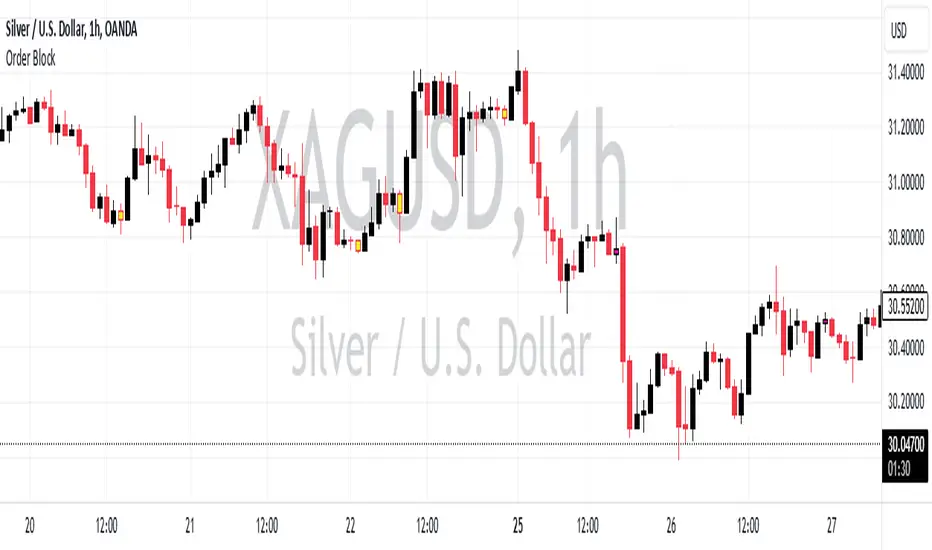
Order Block
Overview:
The Order Block Indicator is designed to help traders identify key bullish and bearish order blocks on their charts. Order blocks are significant price zones where institutional activity may have occurred, often leading to strong reversals or continuations. This indicator visually highlights these blocks and provides alerts for potential trade opportunities.
Key Features
Bullish Order Blocks (Yellow):
Identifies bullish structures where price signals a potential upward movement.
Highlighted in bright yellow to stand out on your chart.
Bearish Order Blocks (Pink):
Detects bearish structures where price suggests a possible downward movement.
Highlighted in pink for easy identification.
Alerts for Order Blocks:
Sends a notification whenever a bullish or bearish order block is detected.
Keeps you informed of key market zones even when you’re away from the screen.
How It Works
Bullish Order Block Criteria
The last candle (close[1]) is bullish (close > open).
The second last candle (close[2]) is bearish (close < open).
The bullish candle’s close is above the high of the bearish candle.
The bearish candle’s close is above the low of the third last candle.
The bearish candle’s low is below the low of the third last candle.
The current candle’s low is above the bearish candle’s high.
These conditions combine to identify strong bullish zones.
Bearish Order Block Criteria
The last candle (close[1]) is bearish (close < open).
The second last candle (close[2]) is bullish (close > open).
The bearish candle’s close is below the low of the bullish candle.
The third last candle’s high is above the bullish candle’s close.
The bullish candle’s high is above the high of the third last candle.
The current candle’s high is below the bullish candle’s low.
This logic highlights potential bearish zones.
How to Use It
Add the Indicator to Your Chart:
Use it on any timeframe to spot bullish or bearish order blocks.
Visual Assistance:
Yellow bars indicate bullish order blocks.
Pink bars represent bearish order blocks.
Set Alerts:
Configure alerts to notify you when a bullish or bearish order block appears.
Customization
Colors: Easily change the colors for bullish and bearish order blocks.
Alerts: Adjust alert messages to suit your trading preferences.
Disclaimer:
This indicator is a technical analysis tool and should be used alongside other strategies and market analysis. It does not guarantee profits and carries trading risks. Always trade responsibly.
오픈 소스 스크립트
트레이딩뷰의 진정한 정신에 따라, 이 스크립트의 작성자는 이를 오픈소스로 공개하여 트레이더들이 기능을 검토하고 검증할 수 있도록 했습니다. 작성자에게 찬사를 보냅니다! 이 코드는 무료로 사용할 수 있지만, 코드를 재게시하는 경우 하우스 룰이 적용된다는 점을 기억하세요.
면책사항
해당 정보와 게시물은 금융, 투자, 트레이딩 또는 기타 유형의 조언이나 권장 사항으로 간주되지 않으며, 트레이딩뷰에서 제공하거나 보증하는 것이 아닙니다. 자세한 내용은 이용 약관을 참조하세요.
오픈 소스 스크립트
트레이딩뷰의 진정한 정신에 따라, 이 스크립트의 작성자는 이를 오픈소스로 공개하여 트레이더들이 기능을 검토하고 검증할 수 있도록 했습니다. 작성자에게 찬사를 보냅니다! 이 코드는 무료로 사용할 수 있지만, 코드를 재게시하는 경우 하우스 룰이 적용된다는 점을 기억하세요.
면책사항
해당 정보와 게시물은 금융, 투자, 트레이딩 또는 기타 유형의 조언이나 권장 사항으로 간주되지 않으며, 트레이딩뷰에서 제공하거나 보증하는 것이 아닙니다. 자세한 내용은 이용 약관을 참조하세요.