OPEN-SOURCE SCRIPT
The Bounded Slope Indicator
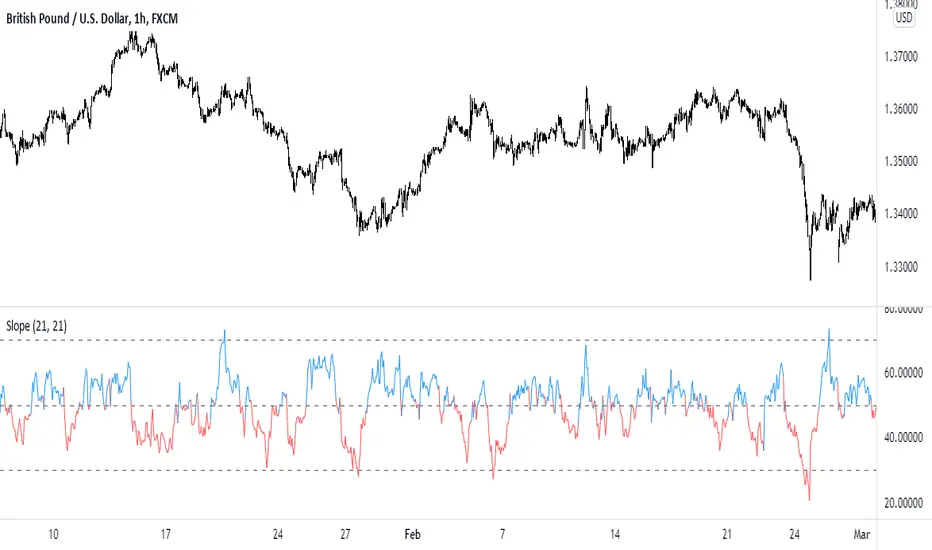
This indicator uses the concept of slopes and normalizes the values so that they are bounded between 0 and 100. The steps required to calculate the indicator are as follows:
* Calculate the slope of the price using a lookback period (by default, it is either 14 or 21). The slope is calculated by subtracting the current close price from the close price 21 (or 14) periods ago and dividing the result by 21 (or 14).
* Calculate the RSI of the slope calculations to get a normalized slope indicator.
The bounded slope indicator can be used the same way as the RSI:
* Through oversold and overbought levels. A bullish bias is present whenever the indicator is close to its oversold level (by default, it is 30) and a bearish bias is present whenever the indicator is close to its overbought level (by default, it is 70).
* Through the divergence technique. A bullish bias is present whenever the indicator is making higher lows and the market is making lower lows. A bearish bias is present whenever the indicator is making lower highs and the market is making higher highs.
The main advantage of the indicator is its different approach to measuring momentum which can be a good uncorrelated indicator to other classical ones (such as the stochastic oscillator and the MACD).
오픈 소스 스크립트
트레이딩뷰의 진정한 정신에 따라, 이 스크립트의 작성자는 이를 오픈소스로 공개하여 트레이더들이 기능을 검토하고 검증할 수 있도록 했습니다. 작성자에게 찬사를 보냅니다! 이 코드는 무료로 사용할 수 있지만, 코드를 재게시하는 경우 하우스 룰이 적용된다는 점을 기억하세요.
면책사항
해당 정보와 게시물은 금융, 투자, 트레이딩 또는 기타 유형의 조언이나 권장 사항으로 간주되지 않으며, 트레이딩뷰에서 제공하거나 보증하는 것이 아닙니다. 자세한 내용은 이용 약관을 참조하세요.
오픈 소스 스크립트
트레이딩뷰의 진정한 정신에 따라, 이 스크립트의 작성자는 이를 오픈소스로 공개하여 트레이더들이 기능을 검토하고 검증할 수 있도록 했습니다. 작성자에게 찬사를 보냅니다! 이 코드는 무료로 사용할 수 있지만, 코드를 재게시하는 경우 하우스 룰이 적용된다는 점을 기억하세요.
면책사항
해당 정보와 게시물은 금융, 투자, 트레이딩 또는 기타 유형의 조언이나 권장 사항으로 간주되지 않으며, 트레이딩뷰에서 제공하거나 보증하는 것이 아닙니다. 자세한 내용은 이용 약관을 참조하세요.