PROTECTED SOURCE SCRIPT
Low Liquidity Marker
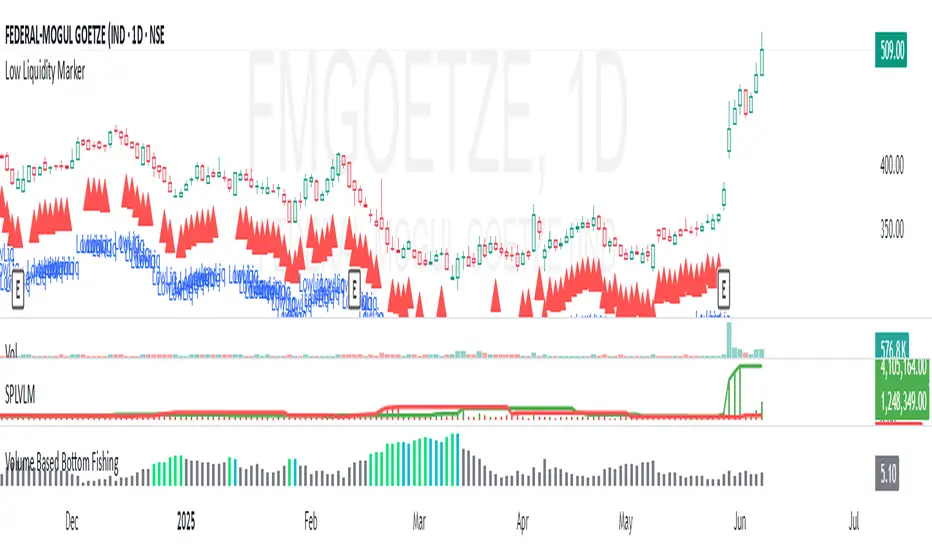
📘 Indicator Description – Low Liquidity Marker
The Low Liquidity Marker is a simple yet powerful tool designed to highlight candles where Volume × Low Price falls below a customizable threshold — signaling potential low liquidity zones on the chart.
🔍 How it works:
It calculates volume × low for each candle.
When this value drops below your defined threshold, a red triangle is plotted below that bar.
These bars may indicate poor institutional participation or market inefficiency.
⚠️ Why it matters:
Low liquidity makes it difficult to build or exit large positions efficiently.
Stocks or instruments flagged by this tool may be suitable for small capital investments but are generally unsuitable for high-volume or institutional-grade trading.
Use this indicator to filter out illiquid setups when screening for quality trades.
🛠 Customizable Input:
Volume × Low Threshold: Tune this parameter based on your instrument or trading timeframe.
💡 Ideal For:
Retail traders avoiding illiquid zones.
Investors wanting to identify where the market lacks sufficient depth.
Enhancing trade filters in systematic or discretionary setups.
보호된 스크립트입니다
이 스크립트는 비공개 소스로 게시됩니다. 하지만 이를 자유롭게 제한 없이 사용할 수 있습니다 – 자세한 내용은 여기에서 확인하세요.
면책사항
해당 정보와 게시물은 금융, 투자, 트레이딩 또는 기타 유형의 조언이나 권장 사항으로 간주되지 않으며, 트레이딩뷰에서 제공하거나 보증하는 것이 아닙니다. 자세한 내용은 이용 약관을 참조하세요.
보호된 스크립트입니다
이 스크립트는 비공개 소스로 게시됩니다. 하지만 이를 자유롭게 제한 없이 사용할 수 있습니다 – 자세한 내용은 여기에서 확인하세요.
면책사항
해당 정보와 게시물은 금융, 투자, 트레이딩 또는 기타 유형의 조언이나 권장 사항으로 간주되지 않으며, 트레이딩뷰에서 제공하거나 보증하는 것이 아닙니다. 자세한 내용은 이용 약관을 참조하세요.