OPEN-SOURCE SCRIPT
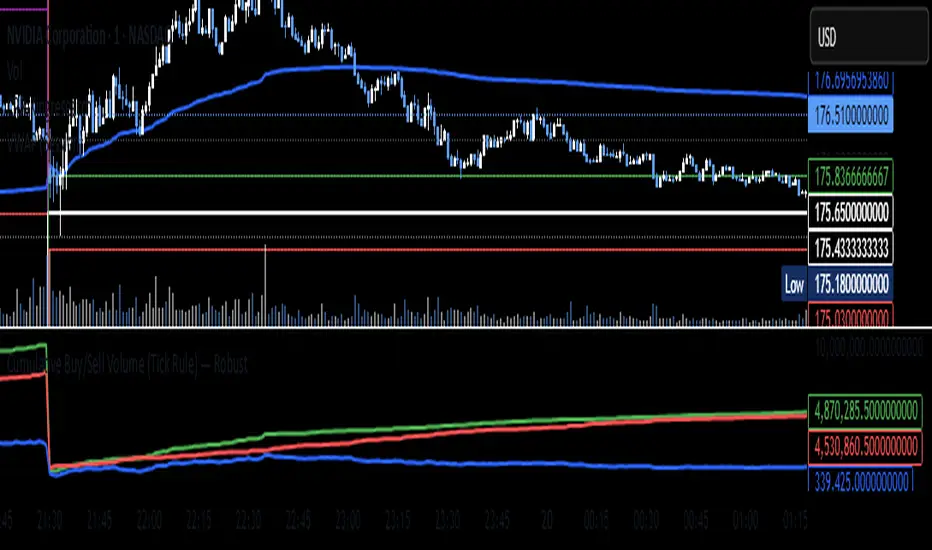
Cumulative Buy/Sell Volume (Tick Rule) — Robust
//version=5
indicator("Cumulative Buy/Sell Volume (Tick Rule) — Robust", overlay=false)
// ------- User inputs -------
resetDaily = input.bool(true, "Reset cumulative at new day/session")
showBarHist = input.bool(false, "Show per-bar buy/sell histogram")
useHalfOnEqual = input.bool(true, "Split volume 50/50 when price unchanged")
// ------- Safe previous close and volume -------
prevClose = nz(close[1], close) // avoid na on first bar
vol = float(volume)
// ------- Classification (Tick Rule approximation) -------
buyVol = close > prevClose ? vol : (close < prevClose ? 0.0 : (useHalfOnEqual ? vol * 0.5 : 0.0))
sellVol = close < prevClose ? vol : (close > prevClose ? 0.0 : (useHalfOnEqual ? vol * 0.5 : 0.0))
// ------- Cumulative totals (with optional daily reset) -------
var float cumBuy = 0.0
var float cumSell = 0.0
newDay = time("D") != time("D")[1]
if resetDaily and newDay
cumBuy := 0.0
cumSell := 0.0
cumBuy := cumBuy + buyVol
cumSell := cumSell + sellVol
cumDelta = cumBuy - cumSell
// ------- Plots -------
plot(cumBuy, title="Cumulative Buy Volume", color=color.green, linewidth=2)
plot(cumSell, title="Cumulative Sell Volume", color=color.red, linewidth=2)
plot(cumDelta, title="Cumulative Delta (Buy - Sell)", color=color.blue, linewidth=2)
// optional: per-bar histograms
plot(showBarHist ? buyVol : na, style=plot.style_columns, title="Bar Buy Vol", color=color.new(color.green, 60))
plot(showBarHist ? sellVol : na, style=plot.style_columns, title="Bar Sell Vol", color=color.new(color.red, 60))
오픈 소스 스크립트
진정한 트레이딩뷰 정신에 따라 이 스크립트 작성자는 트레이더가 기능을 검토하고 검증할 수 있도록 오픈소스로 공개했습니다. 작성자에게 찬사를 보냅니다! 무료로 사용할 수 있지만 코드를 다시 게시할 경우 하우스 룰이 적용된다는 점을 기억하세요.
면책사항
이 정보와 게시물은 TradingView에서 제공하거나 보증하는 금융, 투자, 거래 또는 기타 유형의 조언이나 권고 사항을 의미하거나 구성하지 않습니다. 자세한 내용은 이용 약관을 참고하세요.
오픈 소스 스크립트
진정한 트레이딩뷰 정신에 따라 이 스크립트 작성자는 트레이더가 기능을 검토하고 검증할 수 있도록 오픈소스로 공개했습니다. 작성자에게 찬사를 보냅니다! 무료로 사용할 수 있지만 코드를 다시 게시할 경우 하우스 룰이 적용된다는 점을 기억하세요.
면책사항
이 정보와 게시물은 TradingView에서 제공하거나 보증하는 금융, 투자, 거래 또는 기타 유형의 조언이나 권고 사항을 의미하거나 구성하지 않습니다. 자세한 내용은 이용 약관을 참고하세요.