PROTECTED SOURCE SCRIPT
업데이트됨 Hourly High Volume Detector
Type: Multi-Timeframe Volume Spike Scanner
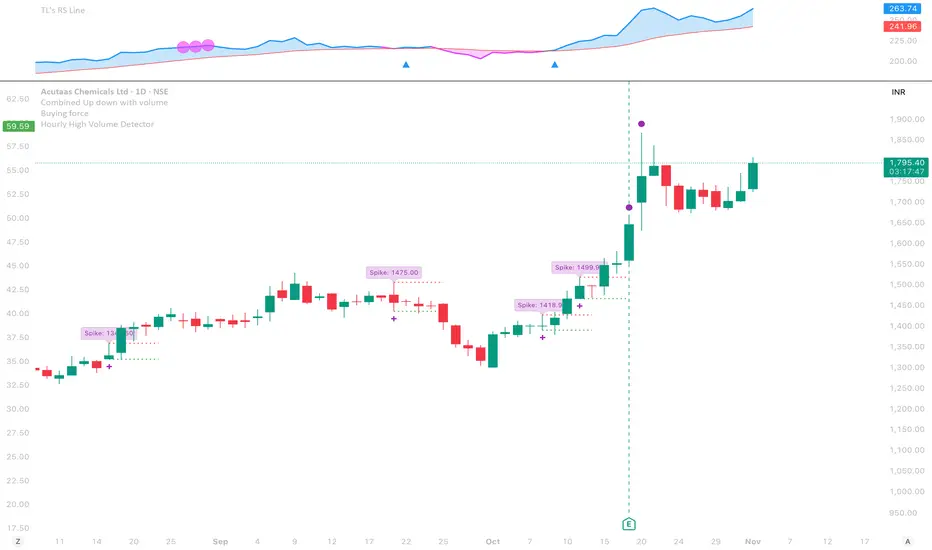
This script detects high-volume hourly candles inside each daily bar to highlight potential institutional activity or hidden accumulation days.
It automatically scans the last N days (configurable lookback) and plots a purple dot below daily candles where at least one hourly candle shows:
Volume significantly higher than the hourly average (Volume Multiplier × Avg Hourly Volume)
Positive price movement exceeding the minimum % threshold
🧠 Trend Filter
A built-in 5-day trend check ensures signals are shown only during non-downtrending phases, filtering out noise when the broader trend is weak.
⚙️ Parameters
Lookback Days: How many recent daily bars to scan.
Volume Multiplier: Defines what counts as a high-volume spike.
Min Price Change %: Minimum % gain within the hourly candle to qualify.
Debug Mode: Enables small green/orange markers for internal logic visualization.
🟣 Signals
Purple Dot (Below Candle): Strong hourly accumulation signal within the day.
(Debug) Green Dot: Hourly condition passed.
(Debug) Orange Triangle: Signal suppressed due to downtrend filter.
⚠️ Notes
Must be used on the Daily timeframe (will warn if not).
Ideal for spotting smart money accumulation, pre-breakout setups, or volume-price anomalies hidden in intraday structure.
릴리즈 노트
In this script - I have added High low lines where the hourly volume has increase by volume this lets us know the order block at what price the institutions are interested릴리즈 노트
Improved : added manual volume, provided label toggle option릴리즈 노트
I've updated the code with:New "Use Trend Filter" toggle - Turn this OFF to see if trend is blocking your signal
Enhanced debug mode - Now shows exactly what's happening:
Current trend status
Maximum volume found vs threshold needed
Maximum % change found vs minimum required
Whether signal was found
To diagnose your issue:
Turn ON "Debug Mode" in settings
Look at today's bar - you'll see a blue label with all the stats
Check if:
Max Volume > Vol Threshold? (if not, lower your multiplier)
Max % Change > Min Required? (if not, lower min price change %)
Trend Up = false? (if so, turn off "Use Trend Filter")
보호된 스크립트입니다
이 스크립트는 비공개 소스로 게시됩니다. 하지만 이를 자유롭게 제한 없이 사용할 수 있습니다 – 자세한 내용은 여기에서 확인하세요.
면책사항
해당 정보와 게시물은 금융, 투자, 트레이딩 또는 기타 유형의 조언이나 권장 사항으로 간주되지 않으며, 트레이딩뷰에서 제공하거나 보증하는 것이 아닙니다. 자세한 내용은 이용 약관을 참조하세요.
보호된 스크립트입니다
이 스크립트는 비공개 소스로 게시됩니다. 하지만 이를 자유롭게 제한 없이 사용할 수 있습니다 – 자세한 내용은 여기에서 확인하세요.
면책사항
해당 정보와 게시물은 금융, 투자, 트레이딩 또는 기타 유형의 조언이나 권장 사항으로 간주되지 않으며, 트레이딩뷰에서 제공하거나 보증하는 것이 아닙니다. 자세한 내용은 이용 약관을 참조하세요.