OPEN-SOURCE SCRIPT
Volume Outlier Signal Detector (Based on IQR)
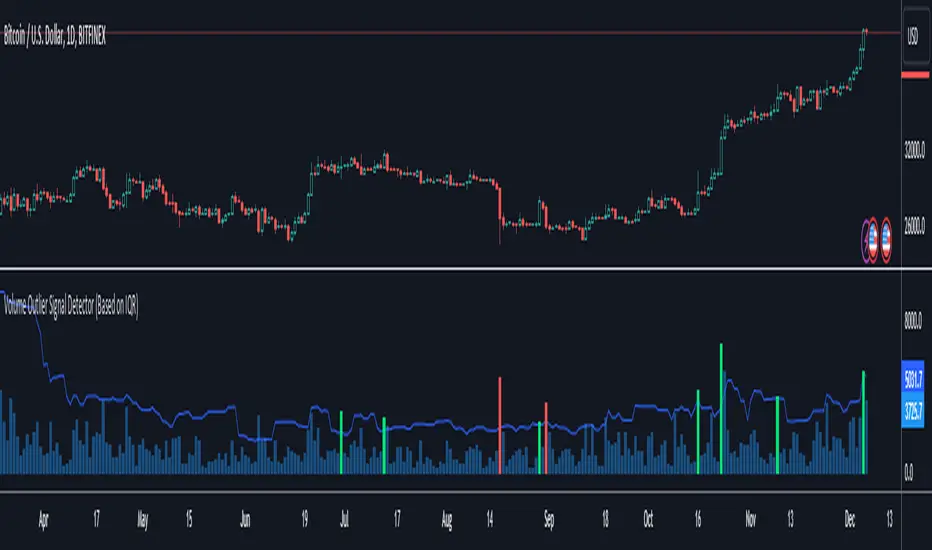
This indicator can detect outliers in trading volume using the 1.5 IQR rule or the outlier formula.
The outlier formula designates outliers based on upper and lower boundaries. Any value that is 1.5 times the Interquartile Range (IQR) greater than the third quartile is designated as an outlier.
The indicator computes the Q3 (75th percentile) and Q1 (25th percentile) of a given volume dataset. The IQR is then calculated by subtracting the Q1 volume from the Q3 volume.
To identify volume outliers, the indicator uses the formula:
Q3 Volume + IQR Multiplier(1.5) * IQR

If the trading volume surpasses the volume outlier, the indicator will display either a green or red column.
A green column indicates that the current bar volume is higher than the volume outlier, and simultaneously, the current bar close is higher than the previous bar's close. Vice versa for the red column.
Moving averages are an optional parameter that can be added to filter out instances where the indicator shows a green or red column. If this option is enabled, the indicator will not display a green column if the price is not above the moving average, and vice versa for red columns.
Several settings can be customized to personalize this indicator, such as setting the moving average filter to higher timeframes. The MA type can also be switched, and IQR settings can be adjusted to fit different markets.
This indicator only works with TradingView charts with volume data.
***Disclaimer:
Before using this indicator for actual trading, make sure to conduct a back test to ensure the strategy is not a losing one in the long run. Apply proper risk management techniques, such as position sizing and using stop loss.
The outlier formula designates outliers based on upper and lower boundaries. Any value that is 1.5 times the Interquartile Range (IQR) greater than the third quartile is designated as an outlier.
The indicator computes the Q3 (75th percentile) and Q1 (25th percentile) of a given volume dataset. The IQR is then calculated by subtracting the Q1 volume from the Q3 volume.
To identify volume outliers, the indicator uses the formula:
Q3 Volume + IQR Multiplier(1.5) * IQR
If the trading volume surpasses the volume outlier, the indicator will display either a green or red column.
A green column indicates that the current bar volume is higher than the volume outlier, and simultaneously, the current bar close is higher than the previous bar's close. Vice versa for the red column.
Moving averages are an optional parameter that can be added to filter out instances where the indicator shows a green or red column. If this option is enabled, the indicator will not display a green column if the price is not above the moving average, and vice versa for red columns.
Several settings can be customized to personalize this indicator, such as setting the moving average filter to higher timeframes. The MA type can also be switched, and IQR settings can be adjusted to fit different markets.
This indicator only works with TradingView charts with volume data.
***Disclaimer:
Before using this indicator for actual trading, make sure to conduct a back test to ensure the strategy is not a losing one in the long run. Apply proper risk management techniques, such as position sizing and using stop loss.
오픈 소스 스크립트
트레이딩뷰의 진정한 정신에 따라, 이 스크립트의 작성자는 이를 오픈소스로 공개하여 트레이더들이 기능을 검토하고 검증할 수 있도록 했습니다. 작성자에게 찬사를 보냅니다! 이 코드는 무료로 사용할 수 있지만, 코드를 재게시하는 경우 하우스 룰이 적용된다는 점을 기억하세요.
면책사항
해당 정보와 게시물은 금융, 투자, 트레이딩 또는 기타 유형의 조언이나 권장 사항으로 간주되지 않으며, 트레이딩뷰에서 제공하거나 보증하는 것이 아닙니다. 자세한 내용은 이용 약관을 참조하세요.
오픈 소스 스크립트
트레이딩뷰의 진정한 정신에 따라, 이 스크립트의 작성자는 이를 오픈소스로 공개하여 트레이더들이 기능을 검토하고 검증할 수 있도록 했습니다. 작성자에게 찬사를 보냅니다! 이 코드는 무료로 사용할 수 있지만, 코드를 재게시하는 경우 하우스 룰이 적용된다는 점을 기억하세요.
면책사항
해당 정보와 게시물은 금융, 투자, 트레이딩 또는 기타 유형의 조언이나 권장 사항으로 간주되지 않으며, 트레이딩뷰에서 제공하거나 보증하는 것이 아닙니다. 자세한 내용은 이용 약관을 참조하세요.