OPEN-SOURCE SCRIPT
업데이트됨 RaenonX - NQ 7 Dashboard
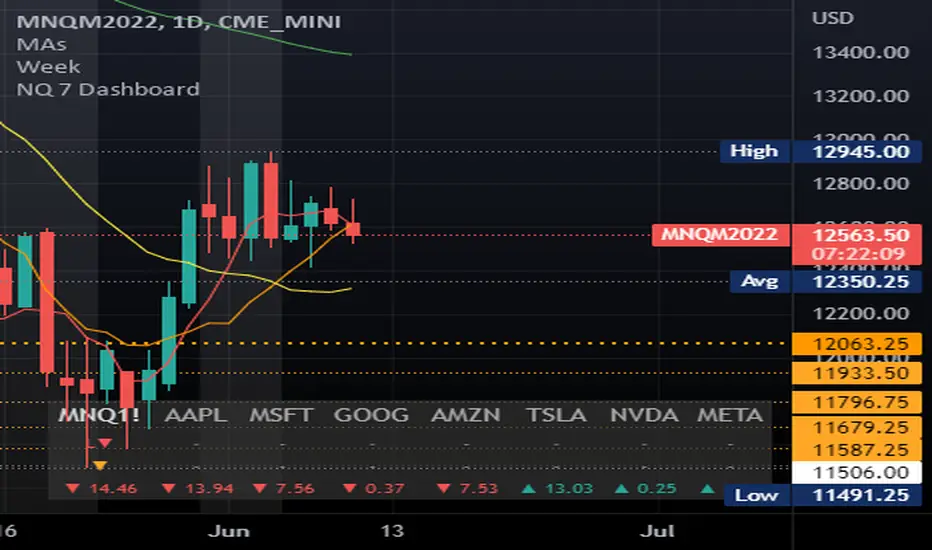
Places a table at the bottom right side showing the top 7 stocks (AAPL, MSFT, GOOG, AMZN, TSLA, NVDA, FB) current position for the given MA and daily position.
The 2nd row shows the current position related to the prior day open/high/low. There are 4 possible values:
The 3rd row shows the current position related to the given SMA parameters. The default period is 22 using 5 minutes timeframe. There are 4 possible values:
The 2nd row shows the current position related to the prior day open/high/low. There are 4 possible values:
- H+: Higher than the prior day high - indicates bullish in daily timeframe.
- O+: Higher than the prior day open - indicates pro-bullish consolidation in daily timeframe.
- L+: Higher than the prior day low - indicates pro-bearish consolidation in daily timeframe.
- L-: Lower than the prior day high - indicates bearish in daily timeframe.
The 3rd row shows the current position related to the given SMA parameters. The default period is 22 using 5 minutes timeframe. There are 4 possible values:
- B+: Higher than the SMA upper band - indicates bullish movement.
- +: Higher than the SMA - indicates pro-bullish movement, possibly consolidating.
- -: Lower than the SMA - indicates pro-bearish movement, possibly consolidating.
- B-: Lower than the SMA lower band - indicates bearish movement.
릴리즈 노트
Updated band StDev input step.릴리즈 노트
Updated symbols & disabled stock out of regular session regardless the settings. 릴리즈 노트
Added index influence value & Optimized performance.릴리즈 노트
Hides main 7 stocks of NDX out of stock trading session (including pre-market and post-market).릴리즈 노트
Replaced position buffering mechanism with Amplitude (was using the same mechanism of Bollinger Bands).릴리즈 노트
Updated ticker from FB to META.오픈 소스 스크립트
트레이딩뷰의 진정한 정신에 따라, 이 스크립트의 작성자는 이를 오픈소스로 공개하여 트레이더들이 기능을 검토하고 검증할 수 있도록 했습니다. 작성자에게 찬사를 보냅니다! 이 코드는 무료로 사용할 수 있지만, 코드를 재게시하는 경우 하우스 룰이 적용된다는 점을 기억하세요.
면책사항
해당 정보와 게시물은 금융, 투자, 트레이딩 또는 기타 유형의 조언이나 권장 사항으로 간주되지 않으며, 트레이딩뷰에서 제공하거나 보증하는 것이 아닙니다. 자세한 내용은 이용 약관을 참조하세요.
오픈 소스 스크립트
트레이딩뷰의 진정한 정신에 따라, 이 스크립트의 작성자는 이를 오픈소스로 공개하여 트레이더들이 기능을 검토하고 검증할 수 있도록 했습니다. 작성자에게 찬사를 보냅니다! 이 코드는 무료로 사용할 수 있지만, 코드를 재게시하는 경우 하우스 룰이 적용된다는 점을 기억하세요.
면책사항
해당 정보와 게시물은 금융, 투자, 트레이딩 또는 기타 유형의 조언이나 권장 사항으로 간주되지 않으며, 트레이딩뷰에서 제공하거나 보증하는 것이 아닙니다. 자세한 내용은 이용 약관을 참조하세요.