OPEN-SOURCE SCRIPT
BTC Slayer 9000 - Relative Risk-adjusted performance
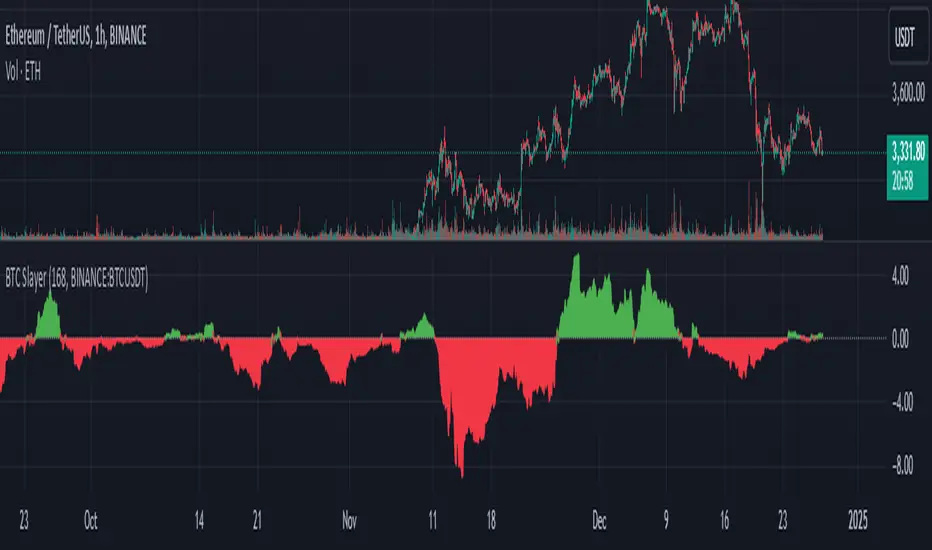
BTC Slayer 9000: Relative Risk-Adjusted Performance
Dear friends and fellow traders,
I am pleased to introduce the BTC Slayer 9000, a script designed to provide clear insights into risk-adjusted performance relative to a benchmark. Whether you're navigating the volatile world of cryptocurrencies or exploring opportunities in stocks, this tool helps you make informed decisions by comparing assets against your chosen benchmark.
What Does It Do?
This indicator is based on the Ulcer Index (UI), a metric that measures downside risk. It calculates the Ulcer Performance Index (UPI), which combines returns and downside risk, and compares it to a benchmark (like BTC/USDT, SPY500, or any trading pair).
The result is the Relative UPI (RUPI):
Positive RUPI (green area): The asset's risk-adjusted performance is better than the benchmark.
Negative RUPI (red area): The asset's risk-adjusted performance is worse than the benchmark.
Why Use It?
Risk vs. Reward: See if the extra risk of an asset is justified by its returns.
Customizable Benchmark: Compare any asset against BTC, SPY500, or another chart.
Dynamic Insights: Quickly identify outperforming assets for long positions and underperformers for potential shorts.
How to Use:
Inputs:
Adjust the lookback period to set the time frame for analysis. 720 Period is meant to represent 30 days. I like to use 168 period because I do not hold trades for long.
Choose your comparison chart (e.g., BTC/USDT, SPY500, AAPL, etc.).
Interpretation:
Green Area Above 0: The asset offers better risk-adjusted returns than the benchmark.
Red Area Below 0: The benchmark is a safer or more rewarding option.
Perfect for All Traders
Whether you:
Trade Cryptocurrencies: Compare altcoins to BTC.
Invest in Stocks: Compare individual stocks to indices like SPY500.
Evaluate Portfolio Options: Decide between assets like AAPL or TSLA.
This indicator equips you with a systematic way to evaluate "Is the extra risk worth it?".
The script was compiled in Collaboration with ChatGPT
오픈 소스 스크립트
트레이딩뷰의 진정한 정신에 따라, 이 스크립트의 작성자는 이를 오픈소스로 공개하여 트레이더들이 기능을 검토하고 검증할 수 있도록 했습니다. 작성자에게 찬사를 보냅니다! 이 코드는 무료로 사용할 수 있지만, 코드를 재게시하는 경우 하우스 룰이 적용된다는 점을 기억하세요.
면책사항
해당 정보와 게시물은 금융, 투자, 트레이딩 또는 기타 유형의 조언이나 권장 사항으로 간주되지 않으며, 트레이딩뷰에서 제공하거나 보증하는 것이 아닙니다. 자세한 내용은 이용 약관을 참조하세요.
오픈 소스 스크립트
트레이딩뷰의 진정한 정신에 따라, 이 스크립트의 작성자는 이를 오픈소스로 공개하여 트레이더들이 기능을 검토하고 검증할 수 있도록 했습니다. 작성자에게 찬사를 보냅니다! 이 코드는 무료로 사용할 수 있지만, 코드를 재게시하는 경우 하우스 룰이 적용된다는 점을 기억하세요.
면책사항
해당 정보와 게시물은 금융, 투자, 트레이딩 또는 기타 유형의 조언이나 권장 사항으로 간주되지 않으며, 트레이딩뷰에서 제공하거나 보증하는 것이 아닙니다. 자세한 내용은 이용 약관을 참조하세요.