PROTECTED SOURCE SCRIPT
TS & AO
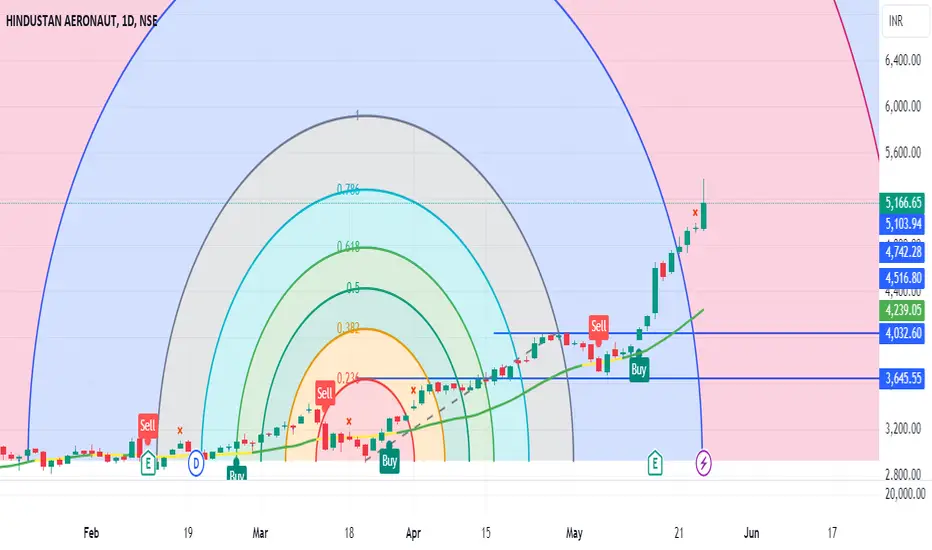
This is Best Intraday and Swing Trading Indicator
Certainly! Let’s explore some intraday and swing trading indicators that can help traders make informed decisions
SuperTrend:
The Supertrend indicator is commonly used for intraday trading.
It is plotted on the price chart and helps determine the current trend.
Parameters: It uses the Average True Range (ATR) with default values of 10 for the period and 3 for the multiplier.
Interpretation:
Upward trend: When Supertrend is below the bars and changes color to green, it indicates a buy signal.
Downward trend: When Supertrend is above the bars and turns red, it signals a sell opportunity1.
VWAP (Volume Weighted Average Price):
VWAP is a volume-based indicator.
It compares the value of a stock traded at a specific time to the total volume traded for that stock.
Interpretation:
Bullish trend: When the stock price is above VWAP, it suggests an uptrend.
Traders can consider buying on retracements toward VWAP in the direction of the trend1.
Moving Averages (MAs):
MAs are versatile indicators suitable for intraday, swing, and longer-term trading.
Common MAs include:
9-day MA: Short-term trend indicator.
50-day MA: Intermediate trend indicator.
100-day MA: Longer-term trend indicator.
Interpretation:
Uptrend: When the stock price is above the MA, it signals a bullish trend.
Downtrend: When the price is below the MA, it suggests a bearish trend2.
보호된 스크립트입니다
이 스크립트는 비공개 소스로 게시됩니다. 하지만 이를 자유롭게 제한 없이 사용할 수 있습니다 – 자세한 내용은 여기에서 확인하세요.
면책사항
해당 정보와 게시물은 금융, 투자, 트레이딩 또는 기타 유형의 조언이나 권장 사항으로 간주되지 않으며, 트레이딩뷰에서 제공하거나 보증하는 것이 아닙니다. 자세한 내용은 이용 약관을 참조하세요.
보호된 스크립트입니다
이 스크립트는 비공개 소스로 게시됩니다. 하지만 이를 자유롭게 제한 없이 사용할 수 있습니다 – 자세한 내용은 여기에서 확인하세요.
면책사항
해당 정보와 게시물은 금융, 투자, 트레이딩 또는 기타 유형의 조언이나 권장 사항으로 간주되지 않으며, 트레이딩뷰에서 제공하거나 보증하는 것이 아닙니다. 자세한 내용은 이용 약관을 참조하세요.