INVITE-ONLY SCRIPT
업데이트됨 Sonarlab - Trendline Liquidity Indicator
**This is not a normal Trend Line Indicator**
Most of the concepts we get thought online are to good to be true. Buy and sell off the touch of the trend line and you will be winning! You probably find out already that this ain't the way to trade. Trend lines mostly gets broken and you will be taken out.
he reason behind this is that the trend lines sparks the interests of Institutions. They use those area's to stop people out and use them as fuel for their positions: Liquidity.
TLL: Trend Line Liquidity
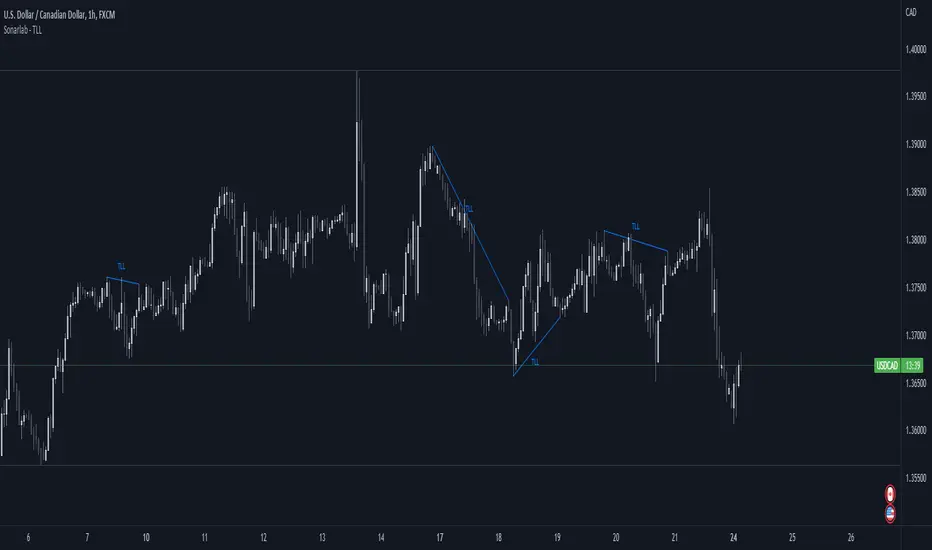
Lets show you an example on how to use these TLL markings 👇

In this example above we can see a beautiful example of the TLL indicator mapping out the TLL. The Imbalance Indicator shows us with the BPR (balanced price range) there is a sign of going short. The other confluence we can add is the TLL, which price likes to clear in these situations.

In this other example we also see two TLL resting on top. We see that price tried to break the SL (swing low), but the fake out detection showed us this was a grab on liquidity. After that we can see that on the LTF we get a displacement and we can assume that price is going to target the TLL.

Another example where price cleared the TLL and used is a targets.
This indicator will map the Trend Line Liquidity for you, so you are more aware of the liquidity that is resting around you. The Indicator has the following inputs:
Sensitivity A lower sensitivity create smaller trend lines, where a higher sensitivity creates bigger trend lines.
Display limit: The amount of lines you want the indicator to display
Line type/ text size (styling options)
Most of the concepts we get thought online are to good to be true. Buy and sell off the touch of the trend line and you will be winning! You probably find out already that this ain't the way to trade. Trend lines mostly gets broken and you will be taken out.
he reason behind this is that the trend lines sparks the interests of Institutions. They use those area's to stop people out and use them as fuel for their positions: Liquidity.
TLL: Trend Line Liquidity
Lets show you an example on how to use these TLL markings 👇
In this example above we can see a beautiful example of the TLL indicator mapping out the TLL. The Imbalance Indicator shows us with the BPR (balanced price range) there is a sign of going short. The other confluence we can add is the TLL, which price likes to clear in these situations.
In this other example we also see two TLL resting on top. We see that price tried to break the SL (swing low), but the fake out detection showed us this was a grab on liquidity. After that we can see that on the LTF we get a displacement and we can assume that price is going to target the TLL.
Another example where price cleared the TLL and used is a targets.
This indicator will map the Trend Line Liquidity for you, so you are more aware of the liquidity that is resting around you. The Indicator has the following inputs:
Sensitivity A lower sensitivity create smaller trend lines, where a higher sensitivity creates bigger trend lines.
Display limit: The amount of lines you want the indicator to display
Line type/ text size (styling options)
릴리즈 노트
- Added option to change the "TLL" text- Fixed the text size bug
릴리즈 노트
- Minor Changes릴리즈 노트
- Added Higher Timeframe TLL option- Added mitigation options
초대 전용 스크립트
이 스크립트는 작성자가 승인한 사용자만 접근할 수 있습니다. 사용하려면 요청 후 승인을 받아야 하며, 일반적으로 결제 후에 허가가 부여됩니다. 자세한 내용은 아래 작성자의 안내를 따르거나 vuetratrading에게 직접 문의하세요.
트레이딩뷰는 스크립트의 작동 방식을 충분히 이해하고 작성자를 완전히 신뢰하지 않는 이상, 해당 스크립트에 비용을 지불하거나 사용하는 것을 권장하지 않습니다. 커뮤니티 스크립트에서 무료 오픈소스 대안을 찾아보실 수도 있습니다.
작성자 지시 사항
Send us a PM or check out the links on our TV profile
면책사항
해당 정보와 게시물은 금융, 투자, 트레이딩 또는 기타 유형의 조언이나 권장 사항으로 간주되지 않으며, 트레이딩뷰에서 제공하거나 보증하는 것이 아닙니다. 자세한 내용은 이용 약관을 참조하세요.