OPEN-SOURCE SCRIPT
업데이트됨 kou_di
The Simple Moving Average (SMA) is the most basic and widely used type of moving average. It’s calculated by taking the arithmetic mean of a given set of prices or data points over a specified period.
SMA = (P1 + P2 + ... + Pn) /n
Where
P1, P2, ... , Pn = prices of data points
n = number of periods
When a new SMA is calculated for a new candle stick, the oldest data point P1 is removed from the original data points (P1 + P2 + ... + Pn) and a new price Pn+1 is added to form a new SMA:
SMA_new = (P2 + ... + Pn + Pn+1) /n
If Pn+1 < P1, SMA line will become downward trend, or if Pn+1 > P1, SMA line will become upward trend. This logic help us predict the moving direction of SMA line which will form the prices trend in the future.
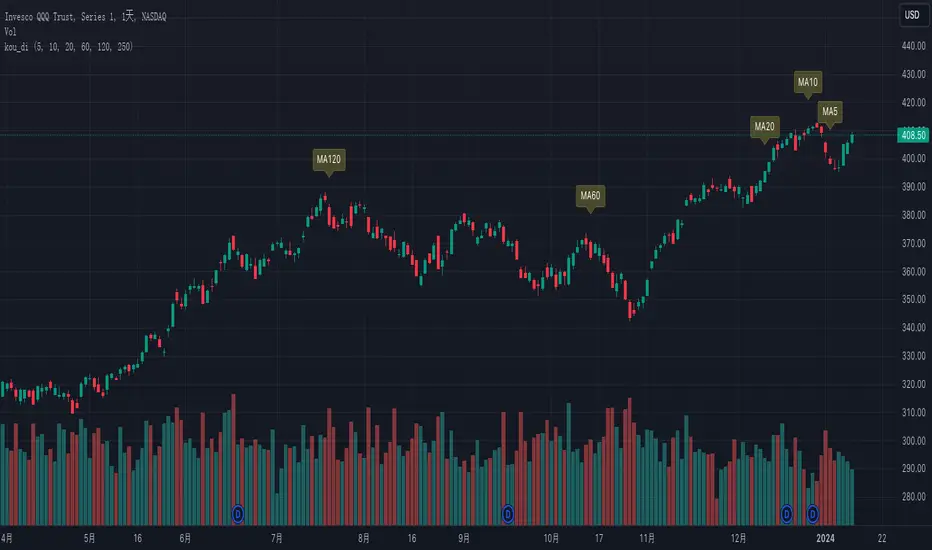
So it's important to highlight the "P1" candle stick for SMAs of different periods to help us predict the trend of SMA lines.
Since SMA5, SMA10, SMA20, SMA60, SMA120, SMA250 are the most popular SMAs, this indicator marks the "P1" candle stick for all of them by default, but you can optionally disable them.
该指标用于显示SMA5, SMA10, SMA20, SMA60, SMA120, SMA250 的扣抵位来监测均线拐点的出现
SMA = (P1 + P2 + ... + Pn) /n
Where
P1, P2, ... , Pn = prices of data points
n = number of periods
When a new SMA is calculated for a new candle stick, the oldest data point P1 is removed from the original data points (P1 + P2 + ... + Pn) and a new price Pn+1 is added to form a new SMA:
SMA_new = (P2 + ... + Pn + Pn+1) /n
If Pn+1 < P1, SMA line will become downward trend, or if Pn+1 > P1, SMA line will become upward trend. This logic help us predict the moving direction of SMA line which will form the prices trend in the future.
So it's important to highlight the "P1" candle stick for SMAs of different periods to help us predict the trend of SMA lines.
Since SMA5, SMA10, SMA20, SMA60, SMA120, SMA250 are the most popular SMAs, this indicator marks the "P1" candle stick for all of them by default, but you can optionally disable them.
该指标用于显示SMA5, SMA10, SMA20, SMA60, SMA120, SMA250 的扣抵位来监测均线拐点的出现
릴리즈 노트
Fix a bug릴리즈 노트
Update the display of labels릴리즈 노트
Addressed comment - Allow changing the color of label and label text오픈 소스 스크립트
트레이딩뷰의 진정한 정신에 따라, 이 스크립트의 작성자는 이를 오픈소스로 공개하여 트레이더들이 기능을 검토하고 검증할 수 있도록 했습니다. 작성자에게 찬사를 보냅니다! 이 코드는 무료로 사용할 수 있지만, 코드를 재게시하는 경우 하우스 룰이 적용된다는 점을 기억하세요.
면책사항
해당 정보와 게시물은 금융, 투자, 트레이딩 또는 기타 유형의 조언이나 권장 사항으로 간주되지 않으며, 트레이딩뷰에서 제공하거나 보증하는 것이 아닙니다. 자세한 내용은 이용 약관을 참조하세요.
오픈 소스 스크립트
트레이딩뷰의 진정한 정신에 따라, 이 스크립트의 작성자는 이를 오픈소스로 공개하여 트레이더들이 기능을 검토하고 검증할 수 있도록 했습니다. 작성자에게 찬사를 보냅니다! 이 코드는 무료로 사용할 수 있지만, 코드를 재게시하는 경우 하우스 룰이 적용된다는 점을 기억하세요.
면책사항
해당 정보와 게시물은 금융, 투자, 트레이딩 또는 기타 유형의 조언이나 권장 사항으로 간주되지 않으며, 트레이딩뷰에서 제공하거나 보증하는 것이 아닙니다. 자세한 내용은 이용 약관을 참조하세요.