PROTECTED SOURCE SCRIPT
업데이트됨 Daily Engulfing Pattern Detector
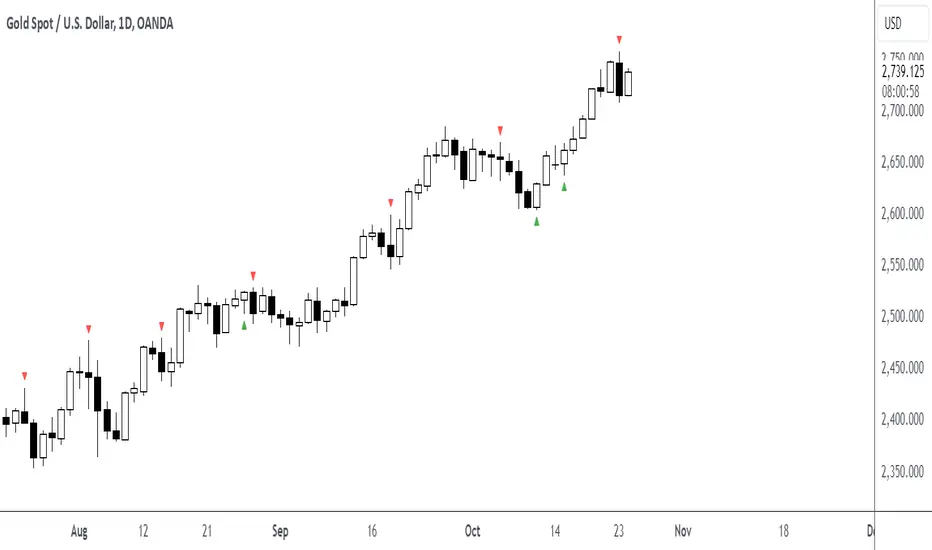
This indicator identifies bullish and bearish engulfing patterns on daily timeframes.
A bullish engulfing pattern occurs when a green candle completely engulfs the previous red candle,
taking out its low and closing above both its open and close prices. This suggests a potential trend reversal from bearish to bullish.
A bearish engulfing pattern occurs when a red candle completely engulfs the previous green candle,
taking out its high and closing below both its open and close prices. This suggests a potential trend reversal from bullish to bearish.
Features:
- Works on daily timeframe by default (customizable)
- Displays visual markers: green triangles for bullish patterns, red triangles for bearish patterns
- Includes built-in alerts for both pattern types
Set up alerts by right-clicking the indicator and selecting "Create Alert"
릴리즈 노트
This indicator identifies bullish and bearish engulfing patterns on daily timeframes.A bullish engulfing pattern occurs when a green candle completely engulfs the previous red candle,
taking out its low and closing above both its open and close prices. This suggests a potential trend reversal from bearish to bullish.
A bearish engulfing pattern occurs when a red candle completely engulfs the previous green candle,
taking out its high and closing below both its open and close prices. This suggests a potential trend reversal from bullish to bearish.
Features:
- Works on daily timeframe by default (customizable)
- Displays visual markers: green triangles for bullish patterns, red triangles for bearish patterns
- Includes built-in alerts for both pattern types
Set up alerts by right-clicking the indicator and selecting "Create Alert"
보호된 스크립트입니다
이 스크립트는 비공개 소스로 게시됩니다. 하지만 이를 자유롭게 제한 없이 사용할 수 있습니다 – 자세한 내용은 여기에서 확인하세요.
면책사항
해당 정보와 게시물은 금융, 투자, 트레이딩 또는 기타 유형의 조언이나 권장 사항으로 간주되지 않으며, 트레이딩뷰에서 제공하거나 보증하는 것이 아닙니다. 자세한 내용은 이용 약관을 참조하세요.
보호된 스크립트입니다
이 스크립트는 비공개 소스로 게시됩니다. 하지만 이를 자유롭게 제한 없이 사용할 수 있습니다 – 자세한 내용은 여기에서 확인하세요.
면책사항
해당 정보와 게시물은 금융, 투자, 트레이딩 또는 기타 유형의 조언이나 권장 사항으로 간주되지 않으며, 트레이딩뷰에서 제공하거나 보증하는 것이 아닙니다. 자세한 내용은 이용 약관을 참조하세요.