OPEN-SOURCE SCRIPT
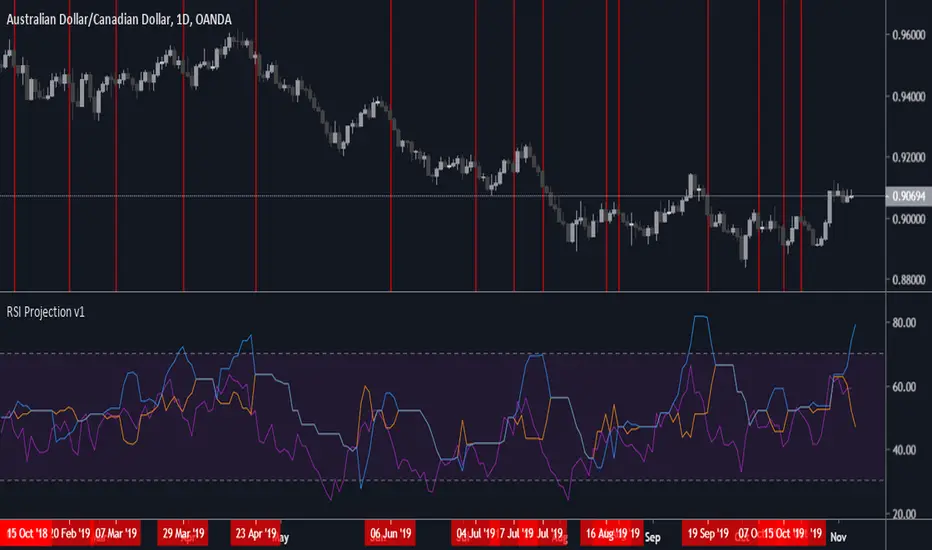
RSI Projection v1
Application of concepts from Constance Brown "Technical Analysis for Trading Professionals", specifically: Chapter 7: Price Projections By Reverse Engineering Indicators, and Chapter 8: Price Objectives Derived From Positive and Negative Reversals In The RSI.
Specifically: I wanted to see if better Exit signals for the RSI could be generated from a basic application of some of the concepts in those chapters, and that is what I've found so far:
Specifically: I wanted to see if better Exit signals for the RSI could be generated from a basic application of some of the concepts in those chapters, and that is what I've found so far:
- Exit when the RSI (purple) crosses below the orange line
- Orange line is forecasted RSI for positive price reversals, blue line is forecasted RSI for negative price reversals
- From what I can tell, this indicator does not work well during chop/consolidation and ranging periods, generating too many false signals without additional confluence from trending indicators and price analysis
- This indicator should be considered highly experimental - do not use live trading without proper backtesting and parameter adjustment.
- Tuning per asset and timeframe is required due to calculation type for highs/lows used for projection calculations
오픈 소스 스크립트
트레이딩뷰의 진정한 정신에 따라, 이 스크립트의 작성자는 이를 오픈소스로 공개하여 트레이더들이 기능을 검토하고 검증할 수 있도록 했습니다. 작성자에게 찬사를 보냅니다! 이 코드는 무료로 사용할 수 있지만, 코드를 재게시하는 경우 하우스 룰이 적용된다는 점을 기억하세요.
면책사항
해당 정보와 게시물은 금융, 투자, 트레이딩 또는 기타 유형의 조언이나 권장 사항으로 간주되지 않으며, 트레이딩뷰에서 제공하거나 보증하는 것이 아닙니다. 자세한 내용은 이용 약관을 참조하세요.
오픈 소스 스크립트
트레이딩뷰의 진정한 정신에 따라, 이 스크립트의 작성자는 이를 오픈소스로 공개하여 트레이더들이 기능을 검토하고 검증할 수 있도록 했습니다. 작성자에게 찬사를 보냅니다! 이 코드는 무료로 사용할 수 있지만, 코드를 재게시하는 경우 하우스 룰이 적용된다는 점을 기억하세요.
면책사항
해당 정보와 게시물은 금융, 투자, 트레이딩 또는 기타 유형의 조언이나 권장 사항으로 간주되지 않으며, 트레이딩뷰에서 제공하거나 보증하는 것이 아닙니다. 자세한 내용은 이용 약관을 참조하세요.