PROTECTED SOURCE SCRIPT
업데이트됨 EMI 1 (v3.1)
After months and months of back-testing. I finally decided to release this update. Would also like to give out a special thanks to TradingView for making it possible to create scripts and share this with the community. I have acquired a lot of information in this community. I believe that when you take, you should also share. That’s why I am sharing this wonderful indicator for free. Remember, knowledge and experience is the most valuable things in life.
EMI, short for Epic Market Indicator:
60-80% theoretically profitable trades, depending on the time period. However if you use EMI blindly, the percentage might even go lower. Nevertheless, there should be enough presenting opportunities, if you use her wisely. Remember, like any instrument, 'practice makes perfect'.
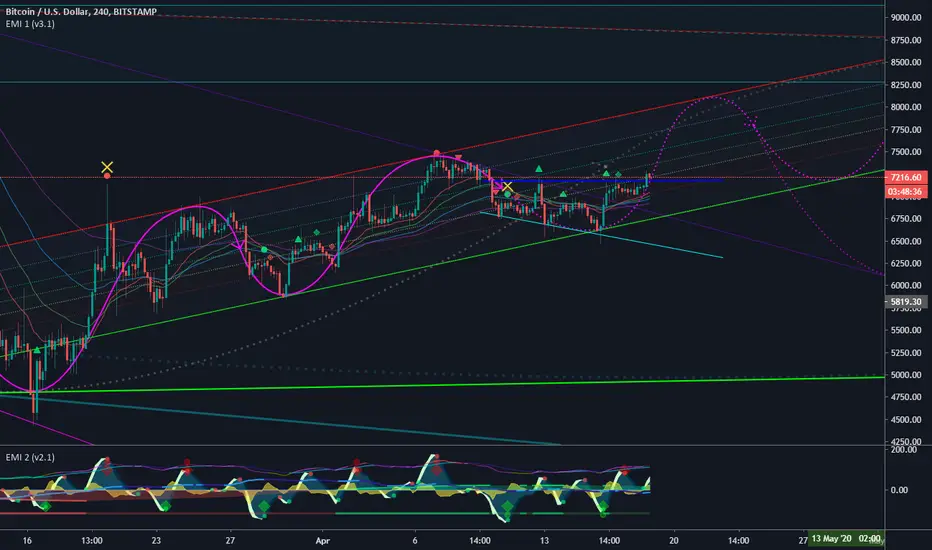
EMI 1 is actually a combination of diverse indicators:
New v3.1:
The signal conditions are based on different oscillators, known by many traders. ALWAYS wait for the candle to close and preferring even more confirmations before taking any consideration nor actions. No signals means most of the time trend continuation. EMI 2 in combination with EMI 1 and traditional authentic pattern formations with a darkened theme is recommended. For more explanation please ask my on streams or join my academy once it's online!
Good luck fellow traders and don't forget to tap the like & follow button. Thanks in advance.
EMI, short for Epic Market Indicator:
60-80% theoretically profitable trades, depending on the time period. However if you use EMI blindly, the percentage might even go lower. Nevertheless, there should be enough presenting opportunities, if you use her wisely. Remember, like any instrument, 'practice makes perfect'.
EMI 1 is actually a combination of diverse indicators:
- Tesla EMA/SMA Ribbon: Periods based upon Nikola Tesla's favorite numbers; 3, 6, 9. (Disabled by default)
- Fibonacci EMA Ribbon: Periods based upon Fibonacci frequency; 21, 34, 55, 89. (Enabled by default)
- Regular EMA/SMA Ribbon: Periods based upon Standard frequency; 10, 20, 100, 200. (Disable by default)
- Pivots (Disabled by default).
- Bollinger bands (Disabled by default).
- Bar trend color (Disabled by default).
- Buy & Sell signals, which makes EMI a unique indicator: Based upon diverse indicators & oscillators buy or sell signals. Not predictions, but high probabilities.(Enabled by default, obviously ^^ )
Red symbols are sell or short signals / Green symbols are buy or long signals.
Dots represents possible price action trend reversals and the diamond symbols could be a possible confirmation and the big X is even a stronger confirmation signal. (A top or bottom, not THE bottom or top). These signals are based upon certain buy & sell conditions by a diversity of indicators known by most traders. Think for example, crossing EMA’s, Stochastic RSI , MACD , oversold and overbought territories.
New v3.1:
- Modified to even more accurate buy & sell signals
- Yellow X
- Bar trend colors based on Money Flow Velocity or Money Flow
The signal conditions are based on different oscillators, known by many traders. ALWAYS wait for the candle to close and preferring even more confirmations before taking any consideration nor actions. No signals means most of the time trend continuation. EMI 2 in combination with EMI 1 and traditional authentic pattern formations with a darkened theme is recommended. For more explanation please ask my on streams or join my academy once it's online!
Good luck fellow traders and don't forget to tap the like & follow button. Thanks in advance.
릴리즈 노트
- fixed ema and sma values 보호된 스크립트입니다
이 스크립트는 비공개 소스로 게시됩니다. 하지만 이를 자유롭게 제한 없이 사용할 수 있습니다 – 자세한 내용은 여기에서 확인하세요.
면책사항
해당 정보와 게시물은 금융, 투자, 트레이딩 또는 기타 유형의 조언이나 권장 사항으로 간주되지 않으며, 트레이딩뷰에서 제공하거나 보증하는 것이 아닙니다. 자세한 내용은 이용 약관을 참조하세요.
면책사항
해당 정보와 게시물은 금융, 투자, 트레이딩 또는 기타 유형의 조언이나 권장 사항으로 간주되지 않으며, 트레이딩뷰에서 제공하거나 보증하는 것이 아닙니다. 자세한 내용은 이용 약관을 참조하세요.