OPEN-SOURCE SCRIPT
업데이트됨 Ultra Liquidity Heatmap
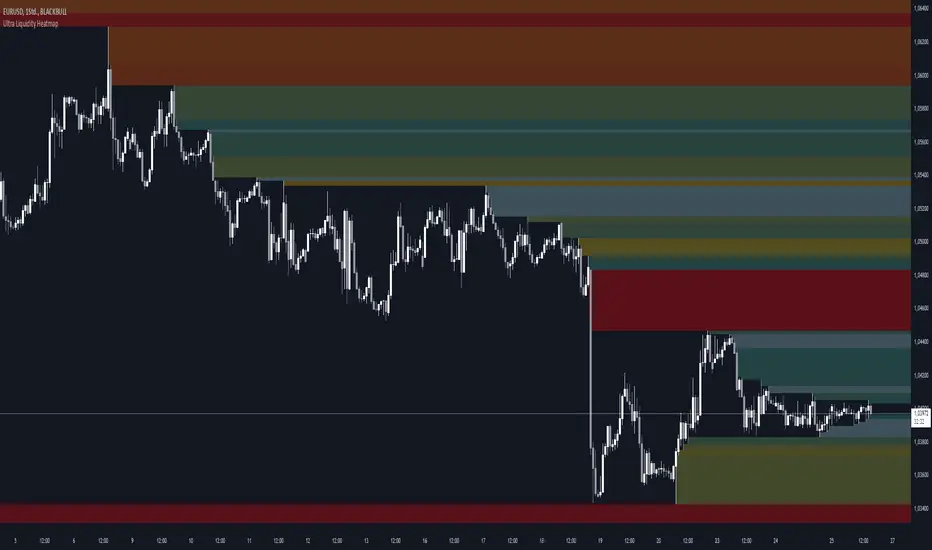
The Ultra Liquditiy Heatmap is a unique visualization tool designed to map out areas of high liquidity on the chart using a dynamic heatmap, helping traders identify significant price zones effectively.
Introduction
The Ultra Liquidity Heatmap is an advanced indicator for visualizing key liquidity areas on your chart. Whether you're a scalper, swing trader, or long-term investor, understanding liquidity dynamics can offer a powerful edge in market analysis. This tool provides a straightforward visual representation of these zones directly on your chart.
Detailed Description
The Ultra Liquidity Heatmap identifies high and low liquidity zones by dynamically marking price ranges with heatmap-like boxes.
.........
.........
The Ultra Liquidity Heatmap bridges the gap between raw price data and actionable market insight. Add it to your toolbox and elevate your trading strategy today!
Introduction
The Ultra Liquidity Heatmap is an advanced indicator for visualizing key liquidity areas on your chart. Whether you're a scalper, swing trader, or long-term investor, understanding liquidity dynamics can offer a powerful edge in market analysis. This tool provides a straightforward visual representation of these zones directly on your chart.
Detailed Description
The Ultra Liquidity Heatmap identifies high and low liquidity zones by dynamically marking price ranges with heatmap-like boxes.
.........
- Dynamic Zone Creation
For low liquidity zones, the script draws boxes extending from the low to the high of the bar. If the price breaks below a previously defined zone, that box is removed.
Similarly, for high liquidity zones, the script tracks and highlights price ranges above the current high, removing boxes if the price exceeds the zone.
..... - Customizable Visuals
Users can adjust the transparency and color of the heatmap, tailoring the visualization to their preference.
..... - Real-Time Updates
The indicator constantly updates as new price data comes in, ensuring that the heatmap reflects the most current liquidity zones.
..... - Efficiency and Scalability
The script uses optimized arrays and a maximum box limit of 500 to ensure smooth performance even on higher timeframes or during high-volatility periods.
.........
The Ultra Liquidity Heatmap bridges the gap between raw price data and actionable market insight. Add it to your toolbox and elevate your trading strategy today!
릴리즈 노트
update version 2added volume coloring and an option to select where the boxes drawn from
릴리즈 노트
rewrote the script beacause of some issues while deleting and drawing boxesadded gradient coloring
removed version 1 (if you need it, PN me)
오픈 소스 스크립트
트레이딩뷰의 진정한 정신에 따라, 이 스크립트의 작성자는 이를 오픈소스로 공개하여 트레이더들이 기능을 검토하고 검증할 수 있도록 했습니다. 작성자에게 찬사를 보냅니다! 이 코드는 무료로 사용할 수 있지만, 코드를 재게시하는 경우 하우스 룰이 적용된다는 점을 기억하세요.
면책사항
해당 정보와 게시물은 금융, 투자, 트레이딩 또는 기타 유형의 조언이나 권장 사항으로 간주되지 않으며, 트레이딩뷰에서 제공하거나 보증하는 것이 아닙니다. 자세한 내용은 이용 약관을 참조하세요.
오픈 소스 스크립트
트레이딩뷰의 진정한 정신에 따라, 이 스크립트의 작성자는 이를 오픈소스로 공개하여 트레이더들이 기능을 검토하고 검증할 수 있도록 했습니다. 작성자에게 찬사를 보냅니다! 이 코드는 무료로 사용할 수 있지만, 코드를 재게시하는 경우 하우스 룰이 적용된다는 점을 기억하세요.
면책사항
해당 정보와 게시물은 금융, 투자, 트레이딩 또는 기타 유형의 조언이나 권장 사항으로 간주되지 않으며, 트레이딩뷰에서 제공하거나 보증하는 것이 아닙니다. 자세한 내용은 이용 약관을 참조하세요.