OPEN-SOURCE SCRIPT
Gamma Blast Detector (Nifty)
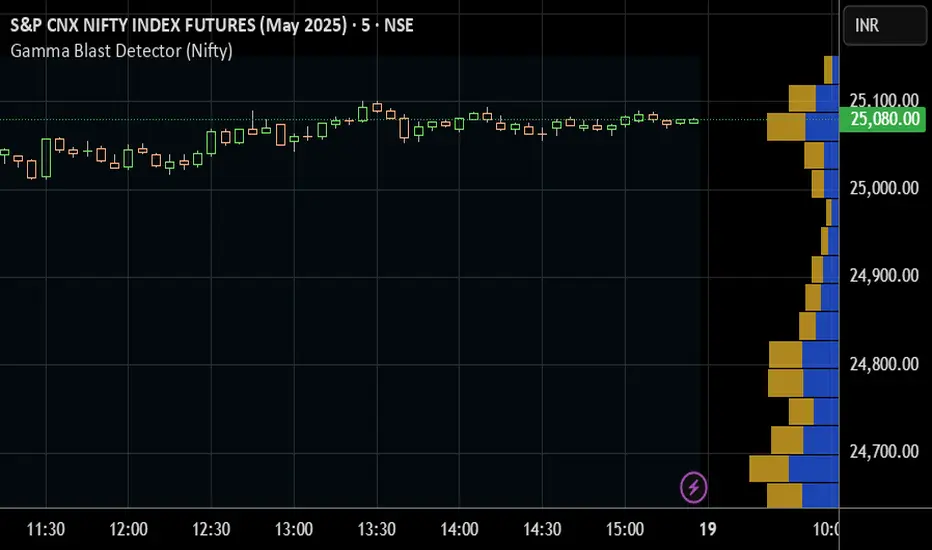
The Gamma Blast Detector (Nifty) is a custom TradingView indicator designed to help intraday traders identify sudden and explosive price movements—commonly referred to as "gamma blasts"—in the Nifty index during the final minutes of the trading session, particularly on expiry days. These movements are typically caused by rapid delta changes in ATM options, resulting in aggressive short-covering or option unwinding.
This indicator specifically monitors price action between 3:10 PM and 3:20 PM IST, which translates to 09:40 AM to 09:50 AM UTC on TradingView. It is optimized for use on 5-minute charts of the Nifty spot or futures index, where gamma-driven volatility is most likely to occur during this time window.
The core logic behind the indicator involves identifying unusually large candles within this time frame. It compares the size of the current candle to the average size of the previous five candles. If the current candle is at least twice as large and shows clear direction (bullish or bearish), the script flags it as a potential gamma blast. A bullish candle suggests a Call Option (CE) is likely to blast upward, while a bearish candle points to a Put Option (PE) gaining sharply.
When such a condition is detected, the indicator visually marks the candle on the chart: a "CE 🚀" label is shown below the candle for a bullish move, and a "PE 🔻" label appears above for a bearish move. It also includes alert conditions, allowing users to set real-time alerts for potential blasts and act quickly.
This tool is especially useful for expiry day scalpers, option traders, and anyone looking to ride momentum generated by gamma effects in the final minutes of the market. It provides a visual and alert-based edge to anticipate short-term, high-impact moves often missed in normal technical analysis.
오픈 소스 스크립트
트레이딩뷰의 진정한 정신에 따라, 이 스크립트의 작성자는 이를 오픈소스로 공개하여 트레이더들이 기능을 검토하고 검증할 수 있도록 했습니다. 작성자에게 찬사를 보냅니다! 이 코드는 무료로 사용할 수 있지만, 코드를 재게시하는 경우 하우스 룰이 적용된다는 점을 기억하세요.
면책사항
해당 정보와 게시물은 금융, 투자, 트레이딩 또는 기타 유형의 조언이나 권장 사항으로 간주되지 않으며, 트레이딩뷰에서 제공하거나 보증하는 것이 아닙니다. 자세한 내용은 이용 약관을 참조하세요.
오픈 소스 스크립트
트레이딩뷰의 진정한 정신에 따라, 이 스크립트의 작성자는 이를 오픈소스로 공개하여 트레이더들이 기능을 검토하고 검증할 수 있도록 했습니다. 작성자에게 찬사를 보냅니다! 이 코드는 무료로 사용할 수 있지만, 코드를 재게시하는 경우 하우스 룰이 적용된다는 점을 기억하세요.
면책사항
해당 정보와 게시물은 금융, 투자, 트레이딩 또는 기타 유형의 조언이나 권장 사항으로 간주되지 않으며, 트레이딩뷰에서 제공하거나 보증하는 것이 아닙니다. 자세한 내용은 이용 약관을 참조하세요.