OPEN-SOURCE SCRIPT
Fisher Volume Transform | AlphaNatt
Fisher Volume Transform | AlphaNatt
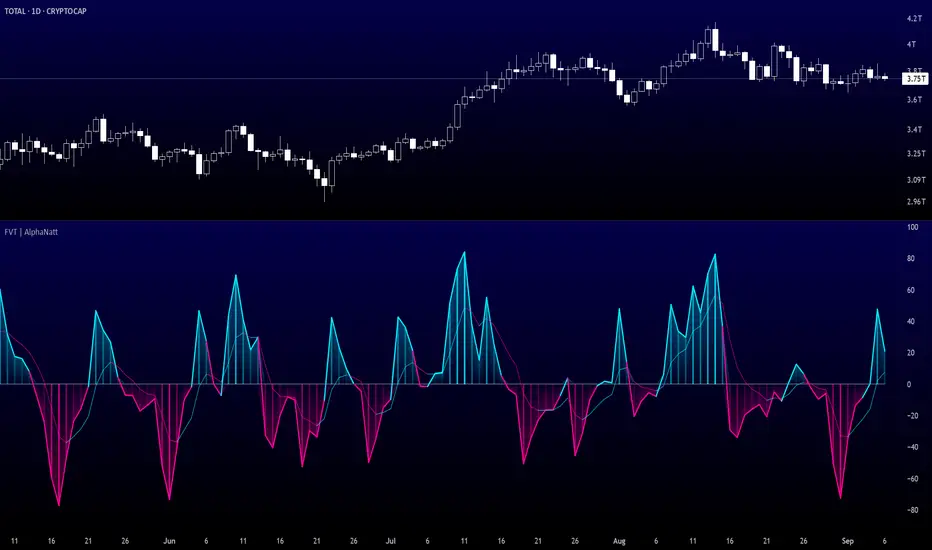
A powerful oscillator that applies the Fisher Transform - converting price into a Gaussian normal distribution - while incorporating volume weighting to identify high-probability reversal points with institutional participation.
━━━━━━━━━━━━━━━━━━━━━━━━━━━━━━━━━━━━━━━━
🎲 THE MATHEMATICS
Fisher Transform Formula:
The Fisher Transform converts any bounded dataset into a Gaussian distribution:
Where x is normalized price (-1 to 1 range)
Why This Matters:
Volume Integration:
Unlike standard Fisher Transform, this version weights price by relative volume:
━━━━━━━━━━━━━━━━━━━━━━━━━━━━━━━━━━━━━━━━
💎 KEY ADVANTAGES
━━━━━━━━━━━━━━━━━━━━━━━━━━━━━━━━━━━━━━━━
⚙️ SETTINGS OPTIMIZATION
Fisher Period (5-30):
Volume Weight (0.1-1.0):
━━━━━━━━━━━━━━━━━━━━━━━━━━━━━━━━━━━━━━━━
📊 TRADING SIGNALS
Primary Signals:
Visual Interpretation:
━━━━━━━━━━━━━━━━━━━━━━━━━━━━━━━━━━━━━━━━
🎯 OPTIMAL USAGE
Best Market Conditions:
Trading Strategies:
1. Extreme Reversal:
Enter when oscillator exceeds ±75 and reverses
2. Zero Line Momentum:
Trade crosses of zero line with volume confirmation
3. Signal Line Strategy:
Early entry on signal line crosses
4. Divergence Trading:
Price makes new high/low but Fisher doesn't
━━━━━━━━━━━━━━━━━━━━━━━━━━━━━━━━━━━━━━━━
Developed by AlphaNatt | Quantitative Trading Systems
Version: 1.0
Classification: Statistical Transform Oscillator
Not financial advice. Always DYOR.
A powerful oscillator that applies the Fisher Transform - converting price into a Gaussian normal distribution - while incorporating volume weighting to identify high-probability reversal points with institutional participation.
"The Fisher Transform reveals what statistics professors have known for decades: when you transform market data into a normal distribution, turning points become crystal clear."
━━━━━━━━━━━━━━━━━━━━━━━━━━━━━━━━━━━━━━━━
🎲 THE MATHEMATICS
Fisher Transform Formula:
The Fisher Transform converts any bounded dataset into a Gaussian distribution:
y = 0.5 × ln((1 + x) / (1 - x))
Where x is normalized price (-1 to 1 range)
Why This Matters:
- Market extremes become statistically identifiable
- Turning points are amplified and clarified
- Removes the skew from price distributions
- Creates nearly instantaneous signals at reversals
Volume Integration:
Unlike standard Fisher Transform, this version weights price by relative volume:
- High volume moves get more weight
- Low volume moves get filtered out
- Identifies institutional participation
- Reduces false signals from retail chop
━━━━━━━━━━━━━━━━━━━━━━━━━━━━━━━━━━━━━━━━
💎 KEY ADVANTAGES
- Statistical Edge: Transforms price into normal distribution where extremes are mathematically defined
- Volume Confirmation: Only signals with volume support
- Early Reversal Detection: Fisher Transform amplifies turning points
- Clean Signals: Gaussian distribution reduces noise
- No Lag: Mathematical transformation, not averaging
━━━━━━━━━━━━━━━━━━━━━━━━━━━━━━━━━━━━━━━━
⚙️ SETTINGS OPTIMIZATION
Fisher Period (5-30):
- 5-9: Very sensitive, many signals
- 10: Default - balanced sensitivity
- 15-20: Moderate smoothing
- 25-30: Major reversals only
Volume Weight (0.1-1.0):
- 0.1-0.3: Minimal volume influence
- 0.5-0.7: Balanced price/volume
- 0.7: Default - strong volume weight
- 0.8-1.0: Volume dominant
━━━━━━━━━━━━━━━━━━━━━━━━━━━━━━━━━━━━━━━━
📊 TRADING SIGNALS
Primary Signals:
- Zero Cross Up: Bullish momentum shift
- Zero Cross Down: Bearish momentum shift
- Signal Line Cross: Early reversal warning
- Extreme Readings (±75): Potential reversal zones
Visual Interpretation:
- Cyan zones: Bullish momentum
- Magenta zones: Bearish momentum
- Gradient intensity: Strength of move
- Histogram: Raw momentum power
━━━━━━━━━━━━━━━━━━━━━━━━━━━━━━━━━━━━━━━━
🎯 OPTIMAL USAGE
Best Market Conditions:
- Range-bound markets (reversals clear)
- High volume periods
- Major support/resistance levels
- Divergence hunting
Trading Strategies:
1. Extreme Reversal:
Enter when oscillator exceeds ±75 and reverses
2. Zero Line Momentum:
Trade crosses of zero line with volume confirmation
3. Signal Line Strategy:
Early entry on signal line crosses
4. Divergence Trading:
Price makes new high/low but Fisher doesn't
━━━━━━━━━━━━━━━━━━━━━━━━━━━━━━━━━━━━━━━━
Developed by AlphaNatt | Quantitative Trading Systems
Version: 1.0
Classification: Statistical Transform Oscillator
Not financial advice. Always DYOR.
오픈 소스 스크립트
트레이딩뷰의 진정한 정신에 따라, 이 스크립트의 작성자는 이를 오픈소스로 공개하여 트레이더들이 기능을 검토하고 검증할 수 있도록 했습니다. 작성자에게 찬사를 보냅니다! 이 코드는 무료로 사용할 수 있지만, 코드를 재게시하는 경우 하우스 룰이 적용된다는 점을 기억하세요.
Free Analysis Platform 👉 alphanatt.com
면책사항
해당 정보와 게시물은 금융, 투자, 트레이딩 또는 기타 유형의 조언이나 권장 사항으로 간주되지 않으며, 트레이딩뷰에서 제공하거나 보증하는 것이 아닙니다. 자세한 내용은 이용 약관을 참조하세요.