PROTECTED SOURCE SCRIPT
Adaptive Average True Range
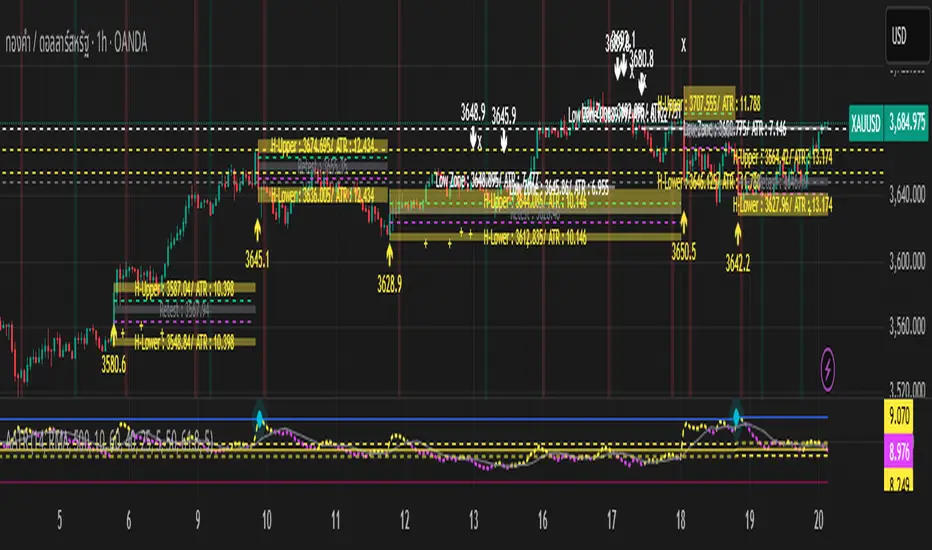
The retest of the candlestick can be categorized into two patterns: a strong trend or a sideways market.
In the case of a strong trend, whether it is a downtrend or an uptrend, the retest often only reaches the box drawn on the wicks. However, sometimes it may only retest the 0.382 level for a downtrend or the 0.732 level for an uptrend. Infrequently, if the asset has sufficient volatility, the price may retest the box on the opposite side of the trend.
In the case of a market entering a sideways phase, whether it's a sideways down or sideways up, the price will typically retest the central box before determining its next direction.
This indicator also measures the standard deviation of the ATR to determine the maximum and minimum price movement, based on another hypothesis regarding "time for a move or time for a slow down," which is plotted as a background color.
Please use this indicator with caution, as it is based solely on a hypothesis.
보호된 스크립트입니다
이 스크립트는 비공개 소스로 게시됩니다. 하지만 이를 자유롭게 제한 없이 사용할 수 있습니다 – 자세한 내용은 여기에서 확인하세요.
면책사항
해당 정보와 게시물은 금융, 투자, 트레이딩 또는 기타 유형의 조언이나 권장 사항으로 간주되지 않으며, 트레이딩뷰에서 제공하거나 보증하는 것이 아닙니다. 자세한 내용은 이용 약관을 참조하세요.
보호된 스크립트입니다
이 스크립트는 비공개 소스로 게시됩니다. 하지만 이를 자유롭게 제한 없이 사용할 수 있습니다 – 자세한 내용은 여기에서 확인하세요.
면책사항
해당 정보와 게시물은 금융, 투자, 트레이딩 또는 기타 유형의 조언이나 권장 사항으로 간주되지 않으며, 트레이딩뷰에서 제공하거나 보증하는 것이 아닙니다. 자세한 내용은 이용 약관을 참조하세요.