PROTECTED SOURCE SCRIPT
업데이트됨 NimhFX Grid Levels
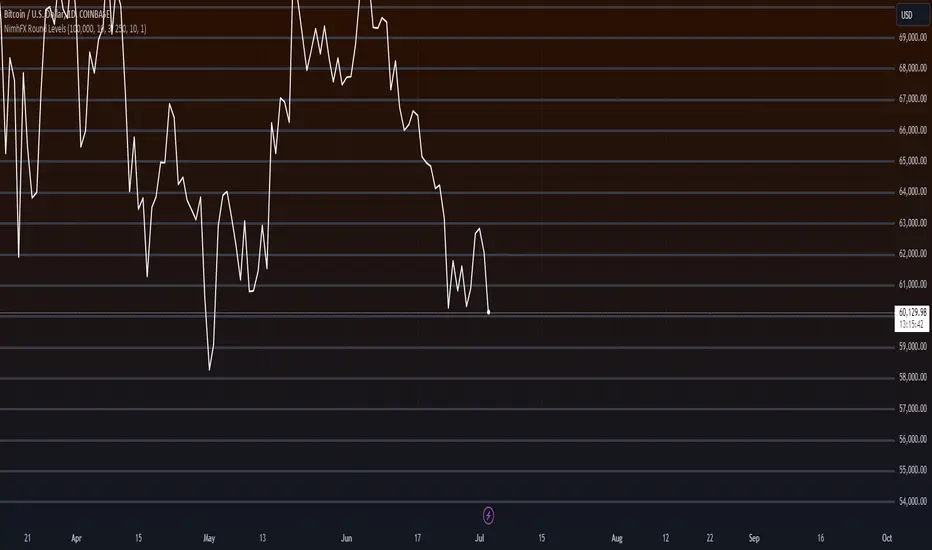
A simple levels indicator for plotting pre-defined price grid.
The default setting is as follows:
Group 1 shows 1000 Point (100 Pip divisions)
Group 2 shows 250 Point (25 Pip divisions)
Groups are duplications of each other to allow multiple divisions to be visible at once, e.g. 100 Pip grid and a 25 pip grid with differing visuals as the default setting.
Number of Lines above/below will alter the amount of lines drawn, change as required, note: Tradingview seems to try to capture all drawings when double-clicking the right price index which can cause this to compress the data.
depending on preferred timeframe you may want to alter this for example to a 10 pip grid (100 point)
릴리즈 노트
Updated to work for Crypto - Adjust division values for specific pairs -
BTC - 100000 will produce levels at 60000, 61000 etc
릴리즈 노트
Updated보호된 스크립트입니다
이 스크립트는 비공개 소스로 게시됩니다. 하지만 이를 자유롭게 제한 없이 사용할 수 있습니다 – 자세한 내용은 여기에서 확인하세요.
면책사항
해당 정보와 게시물은 금융, 투자, 트레이딩 또는 기타 유형의 조언이나 권장 사항으로 간주되지 않으며, 트레이딩뷰에서 제공하거나 보증하는 것이 아닙니다. 자세한 내용은 이용 약관을 참조하세요.
면책사항
해당 정보와 게시물은 금융, 투자, 트레이딩 또는 기타 유형의 조언이나 권장 사항으로 간주되지 않으며, 트레이딩뷰에서 제공하거나 보증하는 것이 아닙니다. 자세한 내용은 이용 약관을 참조하세요.