OPEN-SOURCE SCRIPT
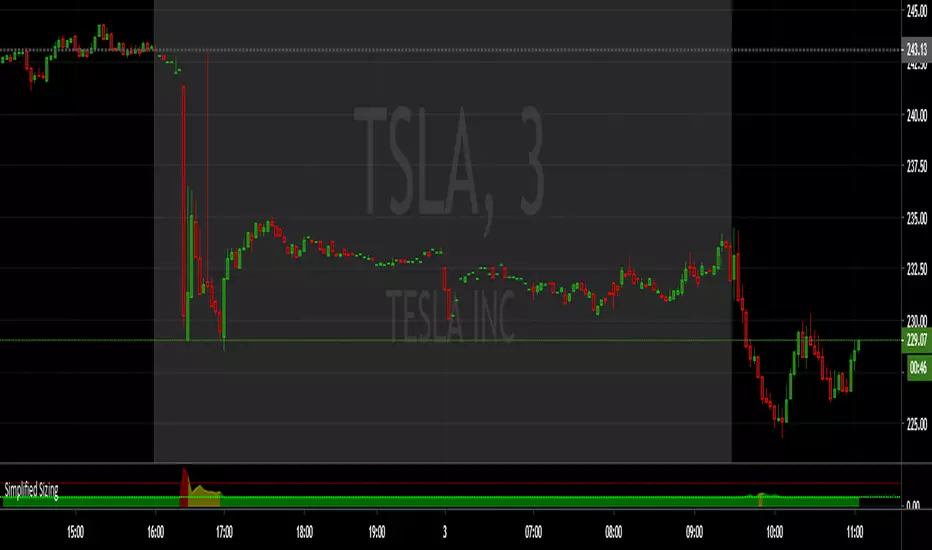
Simplified Sizing

Ensure you Uncheck #1 , #2, #3 in the STYLE tab or it draws the lines you only need the numbers for.
The first number is the deviation from the EMA , anything below 1.75 == 1. (less than 0.75 % deviation)
NOTE: The fill area turns yellow @ 1.50 and red above 2.75
There are steps built in to slightly lower share size when specific levels of divergence register:
From 1.75 to 10 , 1 == 1.10 (10% reduction)
From 10 and up, 1 == 1.20 (20% reduction)
The second number is the Average True Range , calculated by the input length (RMA smoothed) and a multiplier (in decimal form).
NOTE: From 930-936 this value is multiplied by 1.5
The third number is the max share size.
The 4th number is the lot price if you take a position at the max size.
INPUTS:
ATR Length
EMA Length for divergence calculation
ATR Multiplier (0.1 - 10)
Equity in account
Max loss per trade.
Good Luck!
오픈 소스 스크립트
트레이딩뷰의 진정한 정신에 따라, 이 스크립트의 작성자는 이를 오픈소스로 공개하여 트레이더들이 기능을 검토하고 검증할 수 있도록 했습니다. 작성자에게 찬사를 보냅니다! 이 코드는 무료로 사용할 수 있지만, 코드를 재게시하는 경우 하우스 룰이 적용된다는 점을 기억하세요.
면책사항
해당 정보와 게시물은 금융, 투자, 트레이딩 또는 기타 유형의 조언이나 권장 사항으로 간주되지 않으며, 트레이딩뷰에서 제공하거나 보증하는 것이 아닙니다. 자세한 내용은 이용 약관을 참조하세요.
오픈 소스 스크립트
트레이딩뷰의 진정한 정신에 따라, 이 스크립트의 작성자는 이를 오픈소스로 공개하여 트레이더들이 기능을 검토하고 검증할 수 있도록 했습니다. 작성자에게 찬사를 보냅니다! 이 코드는 무료로 사용할 수 있지만, 코드를 재게시하는 경우 하우스 룰이 적용된다는 점을 기억하세요.
면책사항
해당 정보와 게시물은 금융, 투자, 트레이딩 또는 기타 유형의 조언이나 권장 사항으로 간주되지 않으며, 트레이딩뷰에서 제공하거나 보증하는 것이 아닙니다. 자세한 내용은 이용 약관을 참조하세요.