OPEN-SOURCE SCRIPT
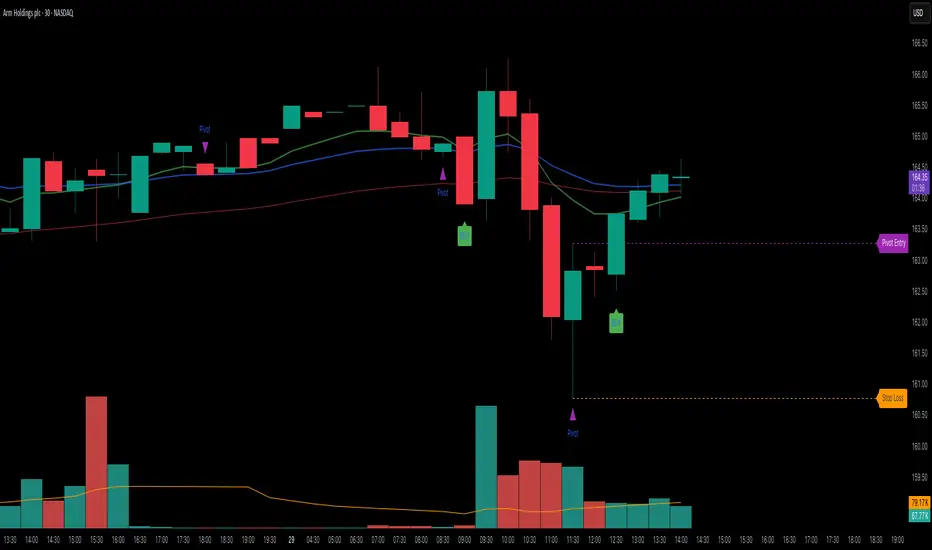
Elite 30 Min Pivot - by TenAM Trader.

🔍 How It Works
Trend Detection:
A trend is defined when a configurable number (default: 3) of same-colored candles (green or red) appear in a row.
The pivot is marked by the first opposite-color candle after the trend.
Signal Logic:
After the pivot forms, the script watches the next few candles (default: 2) for a breakout or close beyond the pivot high/low.
A BUY signal is triggered when price breaks/closes above a pivot high from a downtrend.
A SELL signal is triggered when price breaks/closes below a pivot low from an uptrend.
Entry & Risk Tools:
Optional features include:
Pivot Line – dashed level showing pivot entry point.
Stop Loss Line – opposite side of the pivot candle.
Labels – toggle labels for clarity on entry and risk.
Time Filter – exclude signals during specific hours (e.g. 11 AM–2 PM) to avoid lunchtime chop.
Alerts:
Enable alerts for automated notifications when buy or sell conditions are met.
⚙️ Customizable Settings
Consecutive candles required before pivot
Max bars allowed after pivot for signal
Signal trigger: Break or Close
Toggle visibility of pivot lines, stop loss, and labels
Set excluded time blocks
Enable/disable real-time alerts
✅ Use Case Example
If you set trend length to 3 and signal trigger to “Break,” the script will look for 3 consecutive red candles, then a green candle (pivot). If price breaks above the pivot high within the next 2 candles, a Buy signal will fire.
⚠️ Legal Note
This script is provided for educational and informational purposes only and does not constitute financial advice. Always do your own research before making trading decisions. Use at your own risk.
오픈 소스 스크립트
트레이딩뷰의 진정한 정신에 따라, 이 스크립트의 작성자는 이를 오픈소스로 공개하여 트레이더들이 기능을 검토하고 검증할 수 있도록 했습니다. 작성자에게 찬사를 보냅니다! 이 코드는 무료로 사용할 수 있지만, 코드를 재게시하는 경우 하우스 룰이 적용된다는 점을 기억하세요.
면책사항
해당 정보와 게시물은 금융, 투자, 트레이딩 또는 기타 유형의 조언이나 권장 사항으로 간주되지 않으며, 트레이딩뷰에서 제공하거나 보증하는 것이 아닙니다. 자세한 내용은 이용 약관을 참조하세요.
오픈 소스 스크립트
트레이딩뷰의 진정한 정신에 따라, 이 스크립트의 작성자는 이를 오픈소스로 공개하여 트레이더들이 기능을 검토하고 검증할 수 있도록 했습니다. 작성자에게 찬사를 보냅니다! 이 코드는 무료로 사용할 수 있지만, 코드를 재게시하는 경우 하우스 룰이 적용된다는 점을 기억하세요.
면책사항
해당 정보와 게시물은 금융, 투자, 트레이딩 또는 기타 유형의 조언이나 권장 사항으로 간주되지 않으며, 트레이딩뷰에서 제공하거나 보증하는 것이 아닙니다. 자세한 내용은 이용 약관을 참조하세요.