OPEN-SOURCE SCRIPT
업데이트됨 RoC Momentum Cycle
RoC Momentum Cycles (RMC) is derived from RoC (Rate of Change) indicator.
Motivation behind RMC: Addressing RoC’s Shortcomings
While the Rate of Change (RoC) indicator is a valuable tool for assessing momentum, it has notable limitations that traders must be aware of. One of the primary challenges with the traditional RoC is its sensitivity to price fluctuations, which can lead to false signals in volatile markets. This often results in premature entries or exits, impacting trading performance.
By smoothing out the RoC calculations and focusing on more consistent signal generation (using SMA on smoothed RoC), RMC offers a more consistent representation of price trends.
Momentum Cycles
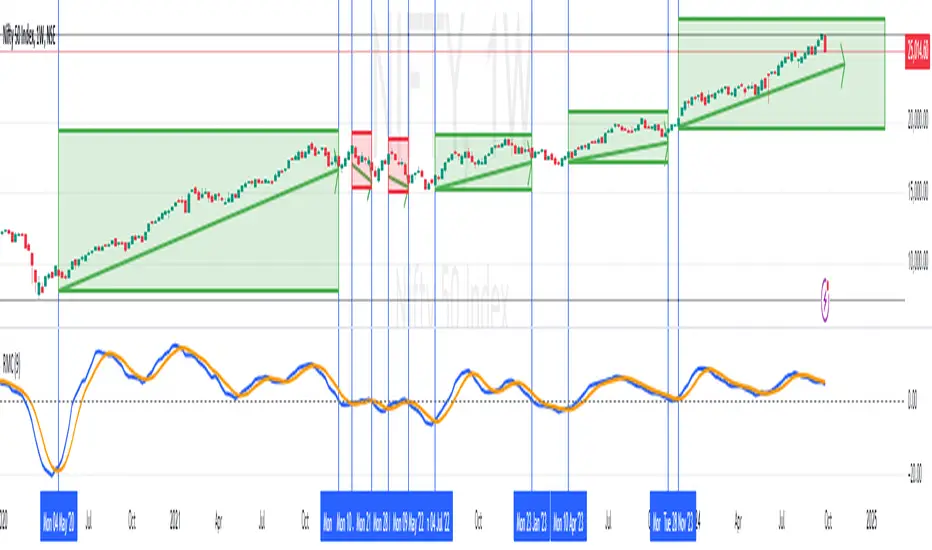
RMC helps visualize momentum cycles in a much better way compared to RoC.
Motivation behind RMC: Addressing RoC’s Shortcomings
While the Rate of Change (RoC) indicator is a valuable tool for assessing momentum, it has notable limitations that traders must be aware of. One of the primary challenges with the traditional RoC is its sensitivity to price fluctuations, which can lead to false signals in volatile markets. This often results in premature entries or exits, impacting trading performance.
By smoothing out the RoC calculations and focusing on more consistent signal generation (using SMA on smoothed RoC), RMC offers a more consistent representation of price trends.
Momentum Cycles
RMC helps visualize momentum cycles in a much better way compared to RoC.
- Long Momentum Cycle: A cross-over of smoothed RoC (blue line) above averaged signal (orange line) below zero marks start of a new potential upside cycle which ends when the blue line comes back to zero line from above.
- Short Momentum Cycle: A cross-under of blue line below orange line above zero marks beginning of a potential downside cycle which ends when the blue line comes back to zero from below.
릴리즈 노트
Updated with annotated chart and fixed a typo in script.릴리즈 노트
Added histogram to the indicator. Enabled by default but can be disabled from the style section under indicator settings.오픈 소스 스크립트
트레이딩뷰의 진정한 정신에 따라, 이 스크립트의 작성자는 이를 오픈소스로 공개하여 트레이더들이 기능을 검토하고 검증할 수 있도록 했습니다. 작성자에게 찬사를 보냅니다! 이 코드는 무료로 사용할 수 있지만, 코드를 재게시하는 경우 하우스 룰이 적용된다는 점을 기억하세요.
True Wave Scanner - scanner.elliottwavestrading.com
면책사항
해당 정보와 게시물은 금융, 투자, 트레이딩 또는 기타 유형의 조언이나 권장 사항으로 간주되지 않으며, 트레이딩뷰에서 제공하거나 보증하는 것이 아닙니다. 자세한 내용은 이용 약관을 참조하세요.
오픈 소스 스크립트
트레이딩뷰의 진정한 정신에 따라, 이 스크립트의 작성자는 이를 오픈소스로 공개하여 트레이더들이 기능을 검토하고 검증할 수 있도록 했습니다. 작성자에게 찬사를 보냅니다! 이 코드는 무료로 사용할 수 있지만, 코드를 재게시하는 경우 하우스 룰이 적용된다는 점을 기억하세요.
True Wave Scanner - scanner.elliottwavestrading.com
면책사항
해당 정보와 게시물은 금융, 투자, 트레이딩 또는 기타 유형의 조언이나 권장 사항으로 간주되지 않으며, 트레이딩뷰에서 제공하거나 보증하는 것이 아닙니다. 자세한 내용은 이용 약관을 참조하세요.