INVITE-ONLY SCRIPT
업데이트됨 SuperTrend (Self-Adjusting Parameters for Highest Profitability)
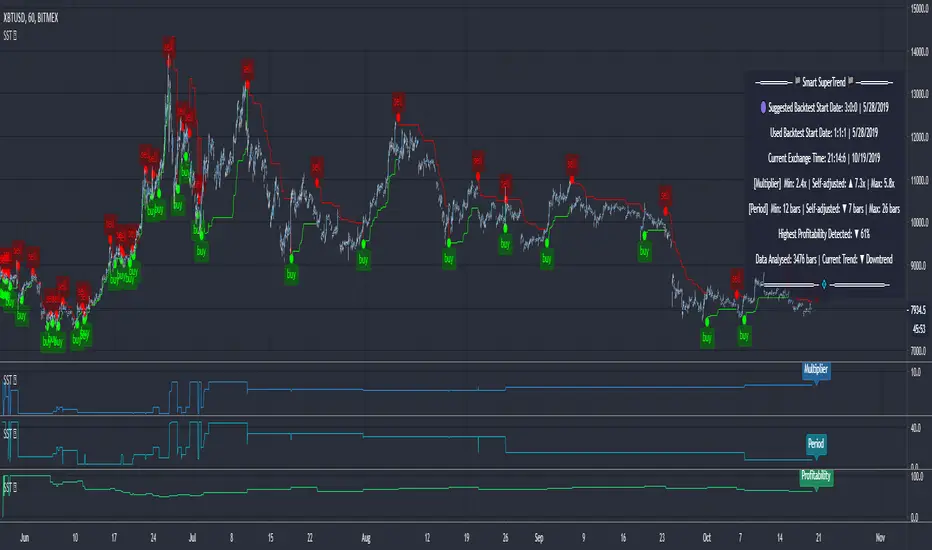
SuperTrend (Self-Adjusting Parameters for Highest Profitability)
The SuperTrend is a trend-following indicator.
It works best when it is used along with other indicators.
It performs well in trending markets and can give false signals in volatile markets.
It becomes Smart when its Multiplier and Period parameters are automatically detected.
• Self-Adjusting Multiplier and Period parameters
• The graphs for Profitability, SuperTrend Multiplier, SuperTrend Period and the SuperTrend itself are available to choose for display from the indicator settings
• A chart layout can be made just for the Smart SuperTrend, having all the graphs nicely displayed
• Alerts for changes in Trend, Multiplier, Period, Profitability
The range for Multiplier, Period and Time can be changed in the indicator settings.
This affects the loading speed (smaller range, faster to load), as well as the accuracy of the signals.
The indicator switches to the most profitable Multiplier and Period parameters automatically, in real-time.
It scans across the entire historical data made available by TradingView.
The Smart SuperTrend works on all timeframes and symbols available on TradingView.
It does not repaint!
But several aspects must be considered:
- 1. TradingView periodically removes access to old data while giving access to new data in real-time.
____ The frequency depends on the timeframe, amount of data. It can happen daily for second charts, weekly for minute charts.
____ Since the Indicator wouldn't have access to that old data anymore, the Profitability may change its value, causing a certain degree of repainting.
- 2. The starting time for Backtest must be inserted in the settings panel.
____ As long as that starting time has available price data, the SuperTrend will NOT get repainted.
____ A suggested starting date for the analysis is shown on the chart. Insert the date in the indicator settings.
This indicator is compatible with the Wrapper Module of the Risk Management System indicator, which means they can work together as a trading bot.
릴리즈 노트
Bug fixes and improvements:• fixed an issue with the suggested start date for analysis
• min and max values for multiplier and period parameters are now suggested on the chart as well
• fixed an issue with the plot used as a signal source
• added a new component to further improve the indicator's effectiveness
초대 전용 스크립트
이 스크립트는 작성자가 승인한 사용자만 접근할 수 있습니다. 사용하려면 요청 후 승인을 받아야 하며, 일반적으로 결제 후에 허가가 부여됩니다. 자세한 내용은 아래 작성자의 안내를 따르거나 KryptoNight에게 직접 문의하세요.
트레이딩뷰는 스크립트의 작동 방식을 충분히 이해하고 작성자를 완전히 신뢰하지 않는 이상, 해당 스크립트에 비용을 지불하거나 사용하는 것을 권장하지 않습니다. 커뮤니티 스크립트에서 무료 오픈소스 대안을 찾아보실 수도 있습니다.
작성자 지시 사항
Join the Discord Server for more info about the published tools.
discord.io/CryptoWorld
a Discord bot for Charting (TradingView and Heatmaps) is available
🟣 If you like any of my Invite-Only Tools, let me know
(DM or Discord for inquiries)
discord.io/CryptoWorld
a Discord bot for Charting (TradingView and Heatmaps) is available
🟣 If you like any of my Invite-Only Tools, let me know
(DM or Discord for inquiries)
면책사항
해당 정보와 게시물은 금융, 투자, 트레이딩 또는 기타 유형의 조언이나 권장 사항으로 간주되지 않으며, 트레이딩뷰에서 제공하거나 보증하는 것이 아닙니다. 자세한 내용은 이용 약관을 참조하세요.