OPEN-SOURCE SCRIPT
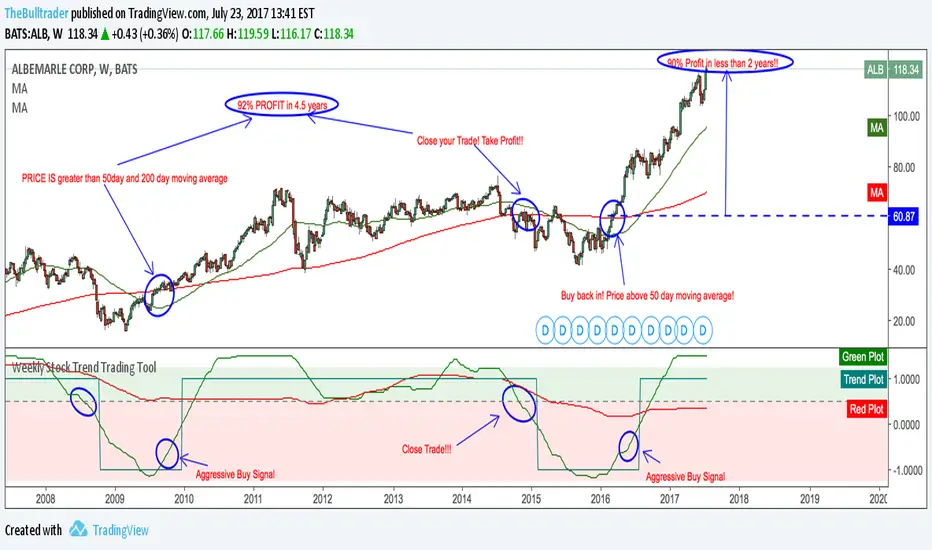
Weekly Stock Trend Trading Tool
// Created by TheBullTrader, 2017.
// Hi everyone, welcome to my Weekly Trend Trading Tool with the 50 day and 200 day moving averages
// This indicator scores each stock/ index individually and scores them on a simple scale -1.5 to +1.5
// This indicator has 2 zones: green zone = bullish, and red zone = bearish
// There are 3 plots: green = 50 day sma, red = 200 day sma, and trend signal= teal
// Buying Signal is when the green plot crosses teal plot or AGGRESSIVE Buy = green plot beginning to curve up from bearish zone.
// Sell Signal is when the green plot enters the RED ZONE
// By using this indicator as described, it will help you pick stock bottoms and COULD GET YOU OUT OF A STOCK CRASH!
// Recommendations is to scan this indicator against the top 100 US stocks with a long stock history greater than 10 years.
// I usually find 5-10 really good deals every few months. Slow and Easy way to build wealth. **Thanks for reading**
오픈 소스 스크립트
트레이딩뷰의 진정한 정신에 따라, 이 스크립트의 작성자는 이를 오픈소스로 공개하여 트레이더들이 기능을 검토하고 검증할 수 있도록 했습니다. 작성자에게 찬사를 보냅니다! 이 코드는 무료로 사용할 수 있지만, 코드를 재게시하는 경우 하우스 룰이 적용된다는 점을 기억하세요.
면책사항
해당 정보와 게시물은 금융, 투자, 트레이딩 또는 기타 유형의 조언이나 권장 사항으로 간주되지 않으며, 트레이딩뷰에서 제공하거나 보증하는 것이 아닙니다. 자세한 내용은 이용 약관을 참조하세요.
오픈 소스 스크립트
트레이딩뷰의 진정한 정신에 따라, 이 스크립트의 작성자는 이를 오픈소스로 공개하여 트레이더들이 기능을 검토하고 검증할 수 있도록 했습니다. 작성자에게 찬사를 보냅니다! 이 코드는 무료로 사용할 수 있지만, 코드를 재게시하는 경우 하우스 룰이 적용된다는 점을 기억하세요.
면책사항
해당 정보와 게시물은 금융, 투자, 트레이딩 또는 기타 유형의 조언이나 권장 사항으로 간주되지 않으며, 트레이딩뷰에서 제공하거나 보증하는 것이 아닙니다. 자세한 내용은 이용 약관을 참조하세요.