OPEN-SOURCE SCRIPT
Sector Momentum

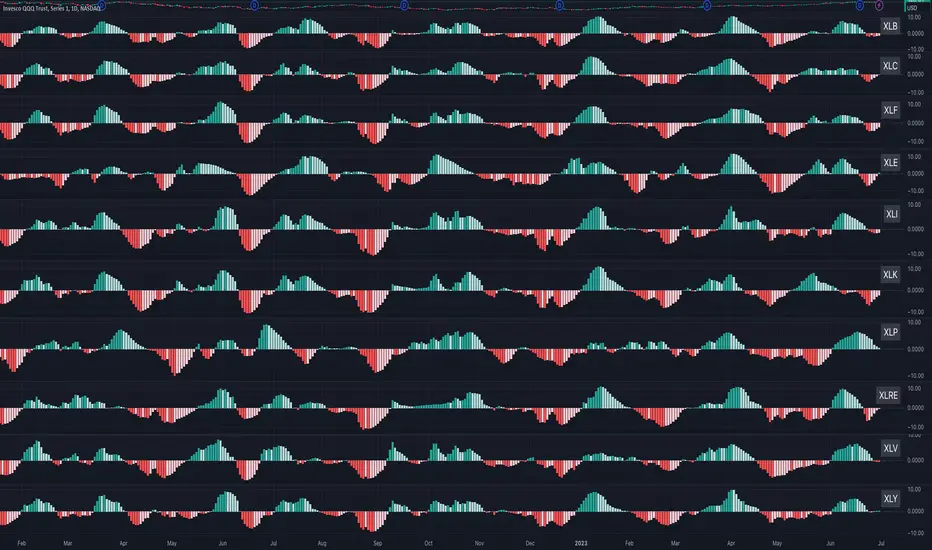
This indicator shows the momentum of a market sector. Under the hood, it's the MACD of the number of stocks above their 20 SMA in a specific sectors. The best insight it gives is to tell if the market is doing a sector rotation or having a full blown correction.
Users have the options to choose a specific sector out of the 11 sectors:
XLB, XLC, XLE, XLF, XLI, XLK, XLP, XLRE, XLU, XLV, XLY or show all them them by adding multiple indicators.
Use this indicator similar to MACD to look for momentum acceleration, deceleration and turn in a sector. More importantly, users can open up the indicator for all sectors and then compare between each.
Examples:
1. When we see momentum slows down in XLP and turn of XLK, it's a sign of sector rotation from consumer staple to tech. Money is going from defensive to riskier assets. Market is leaning towards risk-on mode. Stocks in tech have higher probability to outperform those in consumer staple.
2. When we see momentum subside across all sectors all at once or one by one, particularly both XLP, XLK/XLY, we'd expect market breadth is taking a hit across all sectors. This is not a sector rotation. A short to mid term market correction or drawdown is very likely.
오픈 소스 스크립트
트레이딩뷰의 진정한 정신에 따라, 이 스크립트의 작성자는 이를 오픈소스로 공개하여 트레이더들이 기능을 검토하고 검증할 수 있도록 했습니다. 작성자에게 찬사를 보냅니다! 이 코드는 무료로 사용할 수 있지만, 코드를 재게시하는 경우 하우스 룰이 적용된다는 점을 기억하세요.
면책사항
해당 정보와 게시물은 금융, 투자, 트레이딩 또는 기타 유형의 조언이나 권장 사항으로 간주되지 않으며, 트레이딩뷰에서 제공하거나 보증하는 것이 아닙니다. 자세한 내용은 이용 약관을 참조하세요.
오픈 소스 스크립트
트레이딩뷰의 진정한 정신에 따라, 이 스크립트의 작성자는 이를 오픈소스로 공개하여 트레이더들이 기능을 검토하고 검증할 수 있도록 했습니다. 작성자에게 찬사를 보냅니다! 이 코드는 무료로 사용할 수 있지만, 코드를 재게시하는 경우 하우스 룰이 적용된다는 점을 기억하세요.
면책사항
해당 정보와 게시물은 금융, 투자, 트레이딩 또는 기타 유형의 조언이나 권장 사항으로 간주되지 않으며, 트레이딩뷰에서 제공하거나 보증하는 것이 아닙니다. 자세한 내용은 이용 약관을 참조하세요.