OPEN-SOURCE SCRIPT
업데이트됨 Uber Stochastic Index v2 + Histogram
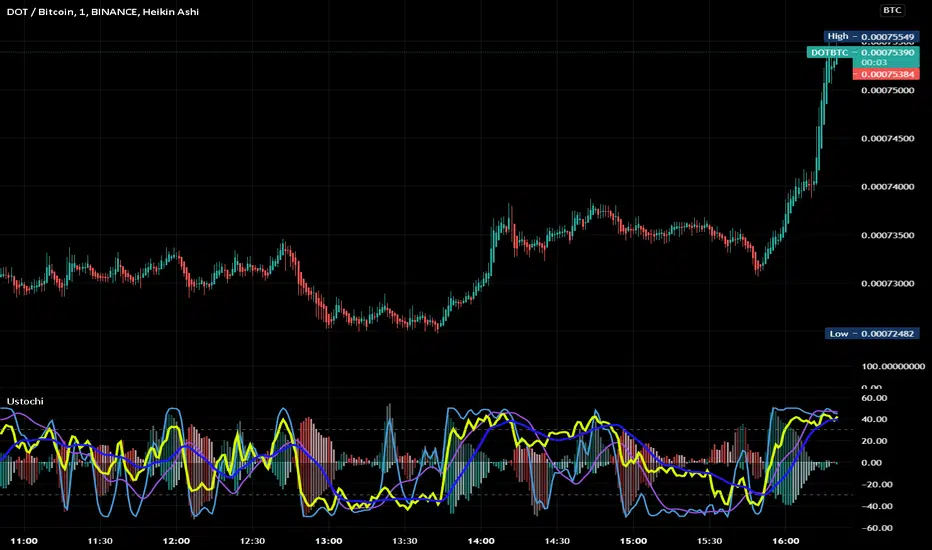
Realized how useful a histogram could be for a Stochastic, so I added it to my Uber Stochastic. It actually has two histograms - one on the primary stochastic, and one on a stochastic of the stochastic. So you can histogram while you histogram and stoch while you stoch.
The second stoch is actually really useful sometimes as a early warning but can get ugly on some settings. The histograms are also quite fast on fast settings.
What separates the Uber from the standard stoch? Well, you get 7 K stochastics, technically, to weigh together into one. Looks like one, but I assure you its 7 complete stochastics. You can have a long term stochastic with short term influence or a short term with long term influence, or have one thats all-encompassing.
Why histograms? Stochastic is already read similar to MACD, with crossover signals derived from two lines reflected in one another, one slower then the other. It just makes sense. This way, with a slower running histogram, you can more readily "see" it close in. After all, the best trades are rarely made when the stochastic crosses, but rather as it approaches crossing.
I included a lot of settings for max tweaking. The histograms seem to shift in size considerably depending how you have it set, hence the resolution settings for each. I actually recommend setting the 2nd histogram to inverted resolution, that way you can see them more clearly, but you will also see them on both sides of 0.
And yes, I offset the stochastic so the histogram would look right.
"Wealth beyond measure, Outlander" -Unknown Dunmer
릴리즈 노트
Just changed plotline order (plots were behind histogram previously... at least the histograms were translucent!) and colors for visiblity.릴리즈 노트
Just a better chart... Woops. Last one was clutter. Got a report for that earlier already... hopefully updating a script to update a chart to avoid breaking a rule isn't breaking the rules. Maybe they should add an option to replace charts...릴리즈 노트
Fixed the colors. It now shows the colors you would expect for the histogram.Also changed divergence settings to hidden and 1 lookback right when you turn them on. Too many divergences. I prefer using my eyes and having the ability to get some help.
Also changed histogram 2 to inverted for better visibility.
오픈 소스 스크립트
트레이딩뷰의 진정한 정신에 따라, 이 스크립트의 작성자는 이를 오픈소스로 공개하여 트레이더들이 기능을 검토하고 검증할 수 있도록 했습니다. 작성자에게 찬사를 보냅니다! 이 코드는 무료로 사용할 수 있지만, 코드를 재게시하는 경우 하우스 룰이 적용된다는 점을 기억하세요.
면책사항
해당 정보와 게시물은 금융, 투자, 트레이딩 또는 기타 유형의 조언이나 권장 사항으로 간주되지 않으며, 트레이딩뷰에서 제공하거나 보증하는 것이 아닙니다. 자세한 내용은 이용 약관을 참조하세요.
오픈 소스 스크립트
트레이딩뷰의 진정한 정신에 따라, 이 스크립트의 작성자는 이를 오픈소스로 공개하여 트레이더들이 기능을 검토하고 검증할 수 있도록 했습니다. 작성자에게 찬사를 보냅니다! 이 코드는 무료로 사용할 수 있지만, 코드를 재게시하는 경우 하우스 룰이 적용된다는 점을 기억하세요.
면책사항
해당 정보와 게시물은 금융, 투자, 트레이딩 또는 기타 유형의 조언이나 권장 사항으로 간주되지 않으며, 트레이딩뷰에서 제공하거나 보증하는 것이 아닙니다. 자세한 내용은 이용 약관을 참조하세요.