PROTECTED SOURCE SCRIPT
Relative Strength Index + MTF VEIODORIO
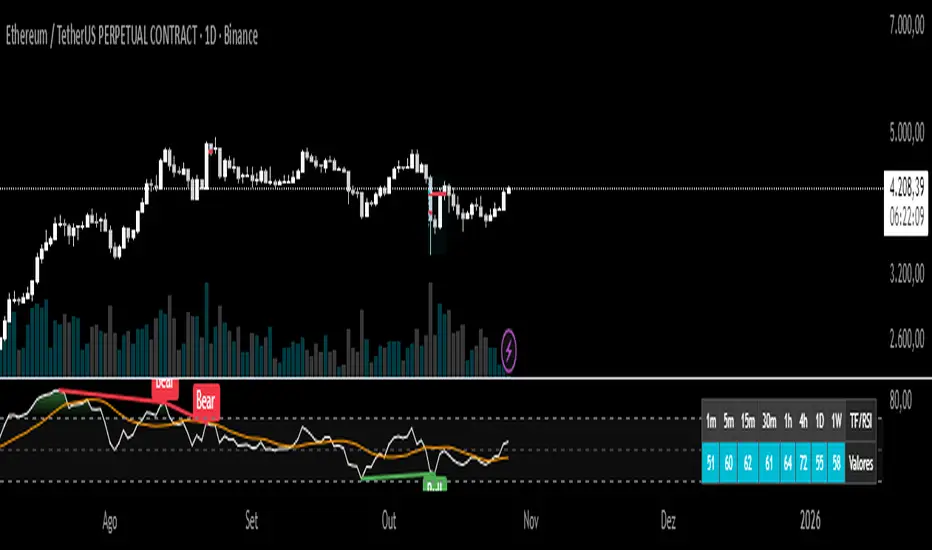
An advanced technical indicator that combines multiple RSI (Relative Strength Index) analysis features into a single, comprehensive tool.
Main Features:
1. Traditional RSI
Calculates the standard Relative Strength Index with a configurable period (default: 14)
Displays overbought and oversold levels
Includes colored background fill for better visualization
2. Multi-Timeframe (MTF) Chart
Displays RSI values simultaneously across 8 different timeframes:
1 minute, 5 minutes, 15 minutes, 30 minutes
1 hour, 4 hours, 1 day, 1 week
보호된 스크립트입니다
이 스크립트는 비공개 소스로 게시됩니다. 하지만 이를 자유롭게 제한 없이 사용할 수 있습니다 – 자세한 내용은 여기에서 확인하세요.
면책사항
해당 정보와 게시물은 금융, 투자, 트레이딩 또는 기타 유형의 조언이나 권장 사항으로 간주되지 않으며, 트레이딩뷰에서 제공하거나 보증하는 것이 아닙니다. 자세한 내용은 이용 약관을 참조하세요.
면책사항
해당 정보와 게시물은 금융, 투자, 트레이딩 또는 기타 유형의 조언이나 권장 사항으로 간주되지 않으며, 트레이딩뷰에서 제공하거나 보증하는 것이 아닙니다. 자세한 내용은 이용 약관을 참조하세요.